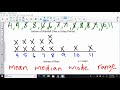
Exploring Line Plots: Mean, Median, Mode, and Range
Interactive Video
•
Mathematics
•
6th - 10th Grade
•
Practice Problem
•
Hard
+2
Standards-aligned

Aiden Montgomery
FREE Resource
Standards-aligned
Read more
10 questions
Show all answers
1.
MULTIPLE CHOICE QUESTION
30 sec • 1 pt
What is the first step in organizing the data set?
Finding the mean
Rewriting the numbers in order from least to greatest
Creating a line plot
Calculating the range
Tags
CCSS.6.SP.B.4
CCSS.HSS.ID.A.1
2.
MULTIPLE CHOICE QUESTION
30 sec • 1 pt
Why is a line plot appropriate for this data set?
Because it is more colorful
Because the range of numbers is very small
Because it is easier to create
Because it shows the exact towns
Tags
CCSS.3.MD.B.4
3.
MULTIPLE CHOICE QUESTION
30 sec • 1 pt
What should the title of the line plot indicate?
The period of data collection
The number of towns
The color of the plot
The type of data being displayed
4.
MULTIPLE CHOICE QUESTION
30 sec • 1 pt
What do the numbers at the bottom of the line plot represent?
The population of the towns
The days of the week
The inches of rainfall
The number of towns
Tags
CCSS.3.MD.B.4
5.
MULTIPLE CHOICE QUESTION
30 sec • 1 pt
What does each 'X' on the line plot represent?
An inch of rain
A day
A town
A month
Tags
CCSS.2.MD.D.9
CCSS.3.MD.B.4
6.
MULTIPLE CHOICE QUESTION
30 sec • 1 pt
How many towns had five inches of rain?
Four
One
Three
Two
Tags
CCSS.2.MD.D.9
CCSS.3.MD.B.4
7.
MULTIPLE CHOICE QUESTION
30 sec • 1 pt
What is the mode of the data set?
Four
Seven
Eight
Eleven
Tags
CCSS.6.SP.B.5C
Access all questions and much more by creating a free account
Create resources
Host any resource
Get auto-graded reports
Continue with Google

Continue with Email
Continue with Microsoft
or continue with

%20(1).png)
Apple
Others
Already have an account?
