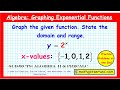
Graphing Exponential Functions: Key Concepts and Techniques
Interactive Video
•
Mathematics
•
8th - 12th Grade
•
Practice Problem
•
Easy
+1
Standards-aligned

Olivia Brooks
Used 5+ times
FREE Resource
Standards-aligned
Read more
10 questions
Show all answers
1.
MULTIPLE CHOICE QUESTION
30 sec • 1 pt
What is the first step in graphing an exponential function?
Drawing the coordinate axes
Identifying the domain and range
Generating a table of values
Plotting the points on the graph
Tags
CCSS.HSF-IF.C.7E
2.
MULTIPLE CHOICE QUESTION
30 sec • 1 pt
If x is -1 in the function y = 2^x, what is the value of y?
2
1
1/2
0
Tags
CCSS.HSF-IF.C.8B
3.
MULTIPLE CHOICE QUESTION
30 sec • 1 pt
What is the value of y when x is 0 in the function y = 2^x?
2
1
4
0
Tags
CCSS.HSF.IF.A.1
4.
MULTIPLE CHOICE QUESTION
30 sec • 1 pt
What is the ordered pair for x = 1 in the function y = 2^x?
(1, 4)
(1, 0)
(1, 2)
(1, 1)
Tags
CCSS.8.F.A.1
CCSS.HSF.IF.A.1
5.
MULTIPLE CHOICE QUESTION
30 sec • 1 pt
What is the y-value when x is 2 in the function y = 2^x?
2
8
16
4
Tags
CCSS.HSF-IF.C.8B
6.
MULTIPLE CHOICE QUESTION
30 sec • 1 pt
How should the x-axis be positioned when graphing the function y = 2^x?
At the top
At the right
In the center
In a lower position
Tags
CCSS.HSF-IF.C.7E
7.
MULTIPLE CHOICE QUESTION
30 sec • 1 pt
What should you do after generating the table of values for an exponential function?
Identify the domain and range
Plot the points on the graph
Solve for x
Find the y-intercept
Tags
CCSS.HSF-IF.C.7E
Access all questions and much more by creating a free account
Create resources
Host any resource
Get auto-graded reports
Continue with Google

Continue with Email
Continue with Classlink
Continue with Clever
or continue with
Microsoft
%20(1).png)
Apple
Others
Already have an account?
Popular Resources on Wayground

8 questions
Spartan Way - Classroom Responsible
Quiz
•
9th - 12th Grade
15 questions
Fractions on a Number Line
Quiz
•
3rd Grade
14 questions
Boundaries & Healthy Relationships
Lesson
•
6th - 8th Grade
20 questions
Equivalent Fractions
Quiz
•
3rd Grade
3 questions
Integrity and Your Health
Lesson
•
6th - 8th Grade
25 questions
Multiplication Facts
Quiz
•
5th Grade
9 questions
FOREST Perception
Lesson
•
KG
20 questions
Main Idea and Details
Quiz
•
5th Grade
Discover more resources for Mathematics
20 questions
Scatter Plots and Line of Best Fit
Quiz
•
8th Grade
12 questions
8th U6 L4 - Fitting a Line to Data
Quiz
•
8th Grade
25 questions
Scatter Plots and Line of Best Fit
Quiz
•
8th Grade
14 questions
finding slope from a graph
Quiz
•
8th Grade
20 questions
Graphing Inequalities on a Number Line
Quiz
•
6th - 9th Grade
20 questions
Pythagorean Theorem Review
Quiz
•
8th Grade
20 questions
Laws of Exponents
Quiz
•
8th Grade
11 questions
Adding and Subtracting Polynomials
Quiz
•
9th Grade