- Resource Library
- Math
- Probability And Statistics
- Line Of Best Fit
- Exploring Linear Correlation Coefficient And Best Fit Lines
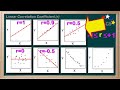
Exploring Linear Correlation Coefficient and Best-Fit Lines
Interactive Video
•
Mathematics
•
8th - 12th Grade
•
Practice Problem
•
Hard
Standards-aligned

Lucas Foster
FREE Resource
Standards-aligned
Read more
10 questions
Show all answers
1.
MULTIPLE CHOICE QUESTION
30 sec • 1 pt
What is the range of the correlation coefficient?
-1 to 1
0 to 2
0 to 1
-1 to 0
Tags
CCSS.HSS.ID.B.5
2.
MULTIPLE CHOICE QUESTION
30 sec • 1 pt
Which graph would make you feel most confident about making a prediction?
Graph with R = -0.5
Graph with R = 0.5
Graph with R = 0
Graph with R = 1
3.
MULTIPLE CHOICE QUESTION
30 sec • 1 pt
What does an R value of 0.9 indicate about the data?
No correlation
Strong linear relationship
Nonlinear relationship
Weak linear relationship
Tags
CCSS.HSF-LE.A.1B
4.
MULTIPLE CHOICE QUESTION
30 sec • 1 pt
How would you describe a graph with R = 0.5?
Nonlinear relationship
Moderate linear relationship
No correlation
Perfect linear relationship
Tags
CCSS.HSS.ID.B.5
5.
MULTIPLE CHOICE QUESTION
30 sec • 1 pt
What does an R value of 0 indicate?
Moderate positive correlation
Perfect linear relationship
No correlation
Strong negative correlation
Tags
CCSS.HSS.ID.B.5
6.
MULTIPLE CHOICE QUESTION
30 sec • 1 pt
What does a negative R value signify?
Data drops as you go to the right
Data rises as you go to the right
Nonlinear relationship
No correlation
Tags
CCSS.HSF-LE.A.1B
7.
MULTIPLE CHOICE QUESTION
30 sec • 1 pt
Which graph would you feel confident about making predictions despite a negative R value?
Graph with R = -0.5
Graph with R = -0.95
Graph with R = 0.4
Graph with R = 0
Access all questions and much more by creating a free account
Create resources
Host any resource
Get auto-graded reports
Continue with Google

Continue with Email
Continue with Microsoft
or continue with

%20(1).png)
Apple
Others
Already have an account?
