Exploring Correlation and Linear Regression with TI-84
Interactive Video
•
Mathematics
•
6th - 10th Grade
•
Practice Problem
•
Hard
+1
Standards-aligned

Jackson Turner
Used 1+ times
FREE Resource
Standards-aligned
Read more
10 questions
Show all answers
1.
MULTIPLE CHOICE QUESTION
30 sec • 1 pt
What is the first step to start using the TI-84 calculator for statistical calculations?
Select the 'Graph' menu
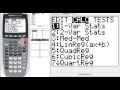
Select the 'Stat' menu
Select the 'Calc' menu
Select the 'Mode' menu
2.
MULTIPLE CHOICE QUESTION
30 sec • 1 pt
How do you clear an existing list in the TI-84 calculator?
Press 'Delete' and then 'Enter'
Press 'Clear' and then 'Enter'
Press 'Backspace' and then 'Enter'
Press 'Reset' and then 'Enter'
3.
MULTIPLE CHOICE QUESTION
30 sec • 1 pt
Which key do you press to move from List 1 to List 2?
Left Arrow
Up Arrow
Down Arrow
Right Arrow
4.
MULTIPLE CHOICE QUESTION
30 sec • 1 pt
What is the form of the linear regression equation provided by the TI-84 calculator?
y = ax + b
y = mx + c
y = mx + b
y = bx + a
Tags
CCSS.8.EE.B.5
5.
MULTIPLE CHOICE QUESTION
30 sec • 1 pt
What additional step is required to view the correlation coefficient and coefficient of determination?
Turn on 'Stat Diagnostics' in the 'Mode' menu
Turn on 'Graph' in the 'Stat' menu
Turn on 'Diagnostics' in the 'Calc' menu
Turn on 'Stat Plot' in the 'Graph' menu
Tags
CCSS.HSS.ID.C.8
6.
MULTIPLE CHOICE QUESTION
30 sec • 1 pt
Where do you go to turn on the 'Stat Diagnostics' feature?
Stat menu
Calc menu
Graph menu
Mode menu
7.
MULTIPLE CHOICE QUESTION
30 sec • 1 pt
What type of plot should be selected to graph the data points?
Histogram
Scatter Plot
Line Plot
Box Plot
Access all questions and much more by creating a free account
Create resources
Host any resource
Get auto-graded reports
Continue with Google

Continue with Email
Continue with Classlink
Continue with Clever
or continue with
Microsoft
%20(1).png)
Apple
Others
Already have an account?
