- Resource Library
- Math
- Functions Operations
- Function Relations
- Exploring Relations, Models, And Functions In Algebra 2
Exploring Relations, Models, and Functions in Algebra 2
Interactive Video
•
Mathematics
•
8th - 12th Grade
•
Practice Problem
•
Hard
Standards-aligned

Liam Anderson
FREE Resource
Standards-aligned
Read more
10 questions
Show all answers
1.
MULTIPLE CHOICE QUESTION
30 sec • 1 pt
Which of the following is an example of a quadratic relation?
y = x^2 - 4x + 4
y = 3x - 5
y = |x|
y = 2x + 3
2.
MULTIPLE CHOICE QUESTION
30 sec • 1 pt
Which of the following is NOT a way to represent relations?
Ordered pairs
Mapping diagrams
Pie charts
Tables of values
Tags
CCSS.8.F.A.1
3.
MULTIPLE CHOICE QUESTION
30 sec • 1 pt
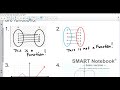
In a mapping diagram, what do the bubbles represent?
X and Y coordinates
Inputs and outputs
Functions and relations
Graphs and tables
Tags
CCSS.8.F.A.1
CCSS.HSF.IF.A.1
4.
MULTIPLE CHOICE QUESTION
30 sec • 1 pt
What is the domain of the relation represented by the ordered pairs (1, 2), (3, 4), and (3, 5)?
{2, 4, 5}
{1, 3}
{1, 2, 3}
{1, 3, 5}
5.
MULTIPLE CHOICE QUESTION
30 sec • 1 pt
How is the range of a relation typically represented?
As a set of ordered pairs
As a list of output values
As a list of input values
As a graph
6.
MULTIPLE CHOICE QUESTION
30 sec • 1 pt
What does it mean if a vertical line intersects a graph at more than one point?
The graph is a quadratic relation
The graph is a linear relation
The graph does not represent a function
The graph represents a function
7.
MULTIPLE CHOICE QUESTION
30 sec • 1 pt
Which of the following is true for a function?
Each input has multiple outputs
Each output has exactly one input
Each input has exactly one output
Each output has multiple inputs
Tags
CCSS.8.F.A.1
Access all questions and much more by creating a free account
Create resources
Host any resource
Get auto-graded reports
Continue with Google

Continue with Email
Continue with Microsoft
or continue with

%20(1).png)
Apple
Others
Already have an account?
