Exploring Linear Regression and Correlation
Interactive Video
•
Mathematics
•
6th - 10th Grade
•
Practice Problem
•
Easy
+2
Standards-aligned

Jackson Turner
Used 5+ times
FREE Resource
Standards-aligned
Read more
10 questions
Show all answers
1.
MULTIPLE CHOICE QUESTION
30 sec • 1 pt
What is the primary focus of the lesson on linear regression and correlation?
Bar charts
Scatter plots
Pie charts
Histograms
Tags
CCSS.HSS.ID.B.5
2.
MULTIPLE CHOICE QUESTION
30 sec • 1 pt
What does a positive correlation indicate about the relationship between two sets of data?
The data points tend to go downwards.
The data points are scattered randomly.
The data points tend to go upwards.
There is no relationship between the data points.
Tags
CCSS.HSF-LE.A.1B
3.
MULTIPLE CHOICE QUESTION
30 sec • 1 pt
Which type of correlation is present when data points tend to decrease as you move along the x-axis?
Perfect correlation
Positive correlation
No correlation
Negative correlation
Tags
CCSS.HSF-LE.A.1B
4.
MULTIPLE CHOICE QUESTION
30 sec • 1 pt
What is the purpose of the line of best fit in a scatter plot?
To find the average of the data points
To estimate the relationship between the data points
To create a histogram
To connect all the data points exactly
Tags
CCSS.8.SP.A.2
5.
MULTIPLE CHOICE QUESTION
30 sec • 1 pt
What must be turned on in the calculator to find the R value?
Graphing mode
Diagnostics
Scientific mode
Stat plot
6.
MULTIPLE CHOICE QUESTION
30 sec • 1 pt
What does an R value close to 1 or -1 indicate?
A strong correlation
A weak correlation
No correlation
A random correlation
Tags
CCSS.HSS.ID.B.5
7.
MULTIPLE CHOICE QUESTION
30 sec • 1 pt
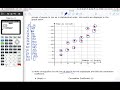
In the example, what is the equation of the line of best fit for the points (-2, 6), (0, 4), (1, -1), and (4, -4)?
y = 0.36x + 3.52
y = -0.36x + 3.52
y = 0.36x - 3.52
y = -0.36x - 3.52
Tags
CCSS.8.EE.B.5
Access all questions and much more by creating a free account
Create resources
Host any resource
Get auto-graded reports
Continue with Google

Continue with Email
Continue with Classlink
Continue with Clever
or continue with
Microsoft
%20(1).png)
Apple
Others
Already have an account?
