- Resource Library
- Math
- Math Word Problems
- Data Word Problems
- Solving Word Problems With Graphs And Data Interpretation
Solving Word Problems with Graphs and Data Interpretation
Interactive Video
•
Mathematics
•
6th - 10th Grade
•
Practice Problem
•
Hard
+3
Standards-aligned

Lucas Foster
FREE Resource
Standards-aligned
8 questions
Show all answers
1.
MULTIPLE CHOICE QUESTION
30 sec • 1 pt
What type of problems are being discussed in this tutorial?
Solving algebraic equations
Reading graphs and charts
Understanding geometric shapes
Learning calculus
Tags
CCSS.6.SP.B.4
CCSS.HSS.ID.A.1
2.
MULTIPLE CHOICE QUESTION
30 sec • 1 pt
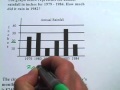
What does the graph represent in the first problem?
Annual rainfall
Population growth
Stock prices
Monthly temperature
Tags
CCSS.8.EE.B.5
3.
MULTIPLE CHOICE QUESTION
30 sec • 1 pt
How much did it rain in 1982 according to the graph?
30 inches
20 inches
10 inches
40 inches
Tags
CCSS.2.MD.B.5
4.
MULTIPLE CHOICE QUESTION
30 sec • 1 pt
What type of graph is used to represent the family's monthly budget?
Line graph
Bar graph
Histogram
Circle graph
5.
MULTIPLE CHOICE QUESTION
30 sec • 1 pt
What percentage of the family's budget is spent on housing?
40%
30%
25%
35%
6.
MULTIPLE CHOICE QUESTION
30 sec • 1 pt
If the family's total monthly income is $2,400, how much is spent on housing?
$600
$720
$960
$840
Tags
CCSS.6.RP.A.3B
7.
MULTIPLE CHOICE QUESTION
30 sec • 1 pt
What is the first step in calculating the amount spent on housing?
Add the percentage to the total income
Subtract the percentage from the total income
Multiply the total income by the percentage
Divide the total income by the percentage
Tags
CCSS.6.RP.A.3C
Access all questions and much more by creating a free account
Create resources
Host any resource
Get auto-graded reports
Continue with Google

Continue with Email
Continue with Microsoft
or continue with

%20(1).png)
Apple
Others
Already have an account?
