Finding Percentages Using Pie Charts
Interactive Video
•
Mathematics
•
6th - 10th Grade
•
Practice Problem
•
Easy
+6
Standards-aligned

Lucas Foster
Used 1+ times
FREE Resource
Standards-aligned
10 questions
Show all answers
1.
MULTIPLE CHOICE QUESTION
30 sec • 1 pt
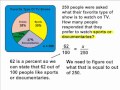
How many people were surveyed about their favorite type of TV show?
350
200
300
250
Tags
CCSS.6.SP.B.5A
2.
MULTIPLE CHOICE QUESTION
30 sec • 1 pt
What percentage of people prefer to watch sports on TV?
30%
25%
35%
40%
3.
MULTIPLE CHOICE QUESTION
30 sec • 1 pt
What percentage of people prefer to watch documentaries on TV?
30%
27%
25%
20%
4.
MULTIPLE CHOICE QUESTION
30 sec • 1 pt
What does the word 'or' indicate in the context of the survey question?
It indicates a choice must be made.
It excludes one category.
It combines two categories.
It separates two unrelated categories.
Tags
CCSS.RI.7.7
CCSS.RI.9-10.7
CCSS.RL.6.7
CCSS.RL.8.7
CCSS.RL.9-10.7
5.
MULTIPLE CHOICE QUESTION
30 sec • 1 pt
What is the combined percentage of people who prefer sports or documentaries?
62%
50%
55%
60%
Tags
CCSS.7.EE.B.3
6.
MULTIPLE CHOICE QUESTION
30 sec • 1 pt
What is half of 250?
100
125
175
150
Tags
CCSS.5.NBT.B.7
7.
MULTIPLE CHOICE QUESTION
30 sec • 1 pt
How do you convert a percentage to a decimal?
Multiply by 100
Multiply by 10
Divide by 10
Divide by 100
Access all questions and much more by creating a free account
Create resources
Host any resource
Get auto-graded reports
Continue with Google

Continue with Email
Continue with Microsoft
or continue with

%20(1).png)
Apple
Others
Already have an account?
