- Resource Library
- Math
- Probability And Statistics
- Line Of Best Fit
- Drawing The Line Of Best Fit In Scatterplots
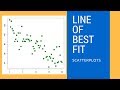
Drawing the Line of Best Fit in Scatterplots
Interactive Video
•
Mathematics
•
6th - 10th Grade
•
Practice Problem
•
Medium
Standards-aligned

Mia Campbell
Used 22+ times
FREE Resource
Standards-aligned
Read more
10 questions
Show all answers
1.
MULTIPLE CHOICE QUESTION
30 sec • 1 pt
What are the three types of correlation that can be determined from a scatter plot?
Strong, Weak, and No Correlation
Positive, Negative, and Weak Correlation
High, Medium, and Low Correlation
Positive, Negative, and No Correlation
Tags
CCSS.HSS.ID.B.5
2.
MULTIPLE CHOICE QUESTION
30 sec • 1 pt
What is the first step in drawing the line of best fit?
Determine the direction of the slope
Draw the line in the middle of the data
Ensure equal distance from the line
Count the number of dots on each side
Tags
CCSS.8.EE.B.5
3.
MULTIPLE CHOICE QUESTION
30 sec • 1 pt
When drawing the line of best fit, where should the line be positioned?
At the top of the data points
In the middle of the data points
To the left of the data points
At the bottom of the data points
Tags
CCSS.8.SP.A.2
4.
MULTIPLE CHOICE QUESTION
30 sec • 1 pt
What should you try to achieve with the dots on both sides of the line of best fit?
More dots on one side
Equal number of dots on both sides
All dots on one side
No dots on either side
Tags
CCSS.8.EE.B.5
5.
MULTIPLE CHOICE QUESTION
30 sec • 1 pt
What makes drawing the line of best fit easier in a scatter plot with high correlation?
The dots are clustered in one area
The dots are spread out
The dots form a clear pattern
The dots are random
Tags
CCSS.8.SP.A.2
6.
MULTIPLE CHOICE QUESTION
30 sec • 1 pt
What is a challenge when drawing the line of best fit for a scatter plot with weak correlation?
The line is always vertical
The line is always diagonal
The line is difficult to position accurately
The line is always horizontal
Tags
CCSS.8.SP.A.2
7.
MULTIPLE CHOICE QUESTION
30 sec • 1 pt
In the first example, how many dots were on one side of the line of best fit?
25
29
33
27
Tags
CCSS.8.EE.B.5
Access all questions and much more by creating a free account
Create resources
Host any resource
Get auto-graded reports
Continue with Google

Continue with Email
Continue with Classlink
Continue with Clever
or continue with
Microsoft
%20(1).png)
Apple
Others
Already have an account?
