- Resource Library
- Math
- Data And Graphing
- Graphing With Tables
- Graphing Quadratic Functions With Data Tables
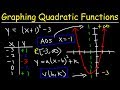
Graphing Quadratic Functions with Data Tables
Interactive Video
•
Mathematics
•
6th - 10th Grade
•
Practice Problem
•
Hard
Standards-aligned

Ethan Morris
FREE Resource
Standards-aligned
10 questions
Show all answers
1.
MULTIPLE CHOICE QUESTION
30 sec • 1 pt
What is the vertex of the quadratic function y = x^2?
(0, 0)
(1, 1)
(-1, 1)
(2, 4)
Tags
CCSS.HSF.IF.A.2
2.
MULTIPLE CHOICE QUESTION
30 sec • 1 pt
If you plug in x = 2 into the function y = x^2, what is the y value?
2
0
1
4
3.
MULTIPLE CHOICE QUESTION
30 sec • 1 pt
What is the domain of the quadratic function y = x^2?
[0, ∞)
[0, 1]
(-∞, 0]
(-∞, ∞)
4.
MULTIPLE CHOICE QUESTION
30 sec • 1 pt
What is the range of the quadratic function y = x^2?
[0, 1]
(-∞, 0]
[0, ∞)
(-∞, ∞)
5.
MULTIPLE CHOICE QUESTION
30 sec • 1 pt
In the vertex form y = a(x - h)^2 + k, what are the coordinates of the vertex?
(a, k)
(h, k)
(a, h)
(k, h)
6.
MULTIPLE CHOICE QUESTION
30 sec • 1 pt
For the function y = (x + 1)^2 - 3, what is the vertex?
(1, 3)
(-1, 3)
(-1, -3)
(1, -3)
7.
MULTIPLE CHOICE QUESTION
30 sec • 1 pt
What is the axis of symmetry for the function y = (x + 1)^2 - 3?
y = -1
x = -1
x = 1
y = 1
Access all questions and much more by creating a free account
Create resources
Host any resource
Get auto-graded reports
Continue with Google

Continue with Email
Continue with Microsoft
or continue with

%20(1).png)
Apple
Others
Already have an account?
