- Resource Library
- Math
- Data And Graphing
- Graphing With Tables
- Graphing Piecewise Functions With A Calculator
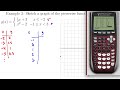
Graphing Piecewise Functions with a Calculator
Interactive Video
•
Mathematics
•
8th - 12th Grade
•
Practice Problem
•
Hard
Standards-aligned

Olivia Brooks
FREE Resource
Standards-aligned
Read more
10 questions
Show all answers
1.
MULTIPLE CHOICE QUESTION
30 sec • 1 pt
What is a piecewise function?
A function with multiple rules based on input values
A function that only uses linear equations
A function with a single rule for all input values
A function that cannot be graphed
2.
MULTIPLE CHOICE QUESTION
30 sec • 1 pt
In a piecewise function, what do the curly brackets represent?
The rules and domains of the function
The x and y intercepts
The range of the function
The slope of the function
Tags
CCSS.HSF-IF.C.7B
3.
MULTIPLE CHOICE QUESTION
30 sec • 1 pt
When graphing the first example, what color was used for the first piece?
Blue
Green
Yellow
Red
Tags
CCSS.HSF-IF.C.7B
4.
MULTIPLE CHOICE QUESTION
30 sec • 1 pt
For the first example, what is the rule for numbers less than or equal to -3?
x - 4
2x - 5
x + 4
-2x - 5
5.
MULTIPLE CHOICE QUESTION
30 sec • 1 pt
In the first example, what type of circle is used at the point (-3, 1) for the first rule?
Open circle
Closed circle
Dashed circle
No circle
Tags
CCSS.HSA.REI.D.12
6.
MULTIPLE CHOICE QUESTION
30 sec • 1 pt
In the second example, what is the rule for numbers smaller than -2?
1/2x + 3
x^2 - 2
2x - 3
x + 3
7.
MULTIPLE CHOICE QUESTION
30 sec • 1 pt
What mistake was corrected in the second example?
The wrong color was used for the second piece
The wrong values were plotted for the first piece
The wrong domain was used for the first piece
The wrong rule was used for the second piece
Tags
CCSS.HSF-IF.C.7B
Access all questions and much more by creating a free account
Create resources
Host any resource
Get auto-graded reports
Continue with Google

Continue with Email
Continue with Classlink
Continue with Clever
or continue with
Microsoft
%20(1).png)
Apple
Others
Already have an account?
Popular Resources on Wayground

15 questions
Fractions on a Number Line
Quiz
•
3rd Grade
20 questions
Equivalent Fractions
Quiz
•
3rd Grade
25 questions
Multiplication Facts
Quiz
•
5th Grade
29 questions
Alg. 1 Section 5.1 Coordinate Plane
Quiz
•
9th Grade
22 questions
fractions
Quiz
•
3rd Grade
11 questions
FOREST Effective communication
Lesson
•
KG
20 questions
Main Idea and Details
Quiz
•
5th Grade
20 questions
Context Clues
Quiz
•
6th Grade
Discover more resources for Mathematics
29 questions
Alg. 1 Section 5.1 Coordinate Plane
Quiz
•
9th Grade
14 questions
finding slope from a graph
Quiz
•
8th Grade
20 questions
Graphing Inequalities on a Number Line
Quiz
•
6th - 9th Grade
8 questions
8th U6L1: Organizing Data
Quiz
•
8th Grade
20 questions
Slope from a Graph
Quiz
•
8th Grade
12 questions
8th U5 Test Review: Functions & Volume
Quiz
•
8th Grade
20 questions
Slope Intercept Form
Quiz
•
7th - 8th Grade
20 questions
Box and Whisker Plots
Quiz
•
9th Grade