- Resource Library
- Math
- Functions Operations
- Vertical Line Test
- Using The Vertical Line Test For Functions
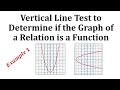
Using the Vertical Line Test for Functions
Interactive Video
•
Mathematics
•
8th - 12th Grade
•
Practice Problem
•
Hard
Standards-aligned

Mia Campbell
FREE Resource
Standards-aligned
Read more
10 questions
Show all answers
1.
MULTIPLE CHOICE QUESTION
30 sec • 1 pt
What is a function in mathematical terms?
A relation where every output is paired with exactly one input.
A relation where every output has multiple inputs.
A relation where every input is paired with exactly one output.
A relation where every input has multiple outputs.
Tags
CCSS.8.F.A.1
2.
MULTIPLE CHOICE QUESTION
30 sec • 1 pt
What test can be used to determine if a graph represents a function?
Curve Test
Vertical Line Test
Slope Test
Horizontal Line Test
3.
MULTIPLE CHOICE QUESTION
30 sec • 1 pt
What does it mean if a vertical line intersects a graph in more than one point?
The graph is a straight line.
The graph does not represent a function.
The graph represents a function.
The graph is a circle.
4.
MULTIPLE CHOICE QUESTION
30 sec • 1 pt
In the first example graph, why is it considered a function?
Because no vertical line intersects the graph in more than one point.
Because it is a circle.
Because it is a straight line.
Because it has multiple outputs for each input.
5.
MULTIPLE CHOICE QUESTION
30 sec • 1 pt
In the second example graph, why does it fail the Vertical Line Test?
Because it is a circle.
Because vertical lines intersect the graph in more than one point.
Because it has only one output for each input.
Because it is a straight line.
6.
MULTIPLE CHOICE QUESTION
30 sec • 1 pt
What happens at the x-value of 2 in the second example graph?
There are three corresponding y-values.
There are no corresponding y-values.
There is only one corresponding y-value.
There are two corresponding y-values.
7.
MULTIPLE CHOICE QUESTION
30 sec • 1 pt
In the third example graph, why is it considered a function?
Because no vertical line intersects the graph in more than one point.
Because it has multiple outputs for each input.
Because it is a circle.
Because it is a straight line.
Access all questions and much more by creating a free account
Create resources
Host any resource
Get auto-graded reports
Continue with Google

Continue with Email
Continue with Microsoft
or continue with

%20(1).png)
Apple
Others
Already have an account?
