Interpreting Graphs of Functions
Interactive Video
•
Mathematics
•
6th - 10th Grade
•
Practice Problem
•
Easy
+5
Standards-aligned

Liam Anderson
Used 4+ times
FREE Resource
Standards-aligned
Read more
10 questions
Show all answers
1.
MULTIPLE CHOICE QUESTION
30 sec • 1 pt
What is the purpose of the vertical line test?
To calculate the area under the curve
To find the intercepts of a graph
To measure the slope of a graph
To determine if a graph is a function
2.
MULTIPLE CHOICE QUESTION
30 sec • 1 pt
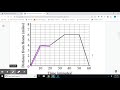
What does the x-axis represent in the temperature vs. time graph?
Time of day
Speed
Temperature
Distance
Tags
CCSS.8.EE.B.5
3.
MULTIPLE CHOICE QUESTION
30 sec • 1 pt
During which time period does the temperature increase at a steady rate?
9 a.m. to 3 p.m.
3 p.m. to 6 p.m.
9 p.m. to 12 a.m.
6 p.m. to 9 p.m.
Tags
CCSS.HSF.IF.B.4
4.
MULTIPLE CHOICE QUESTION
30 sec • 1 pt
What happens to the temperature from 3 p.m. to 6 p.m.?
It remains constant
It fluctuates
It increases at a steady rate
It decreases at a steady rate
Tags
CCSS.HSF.IF.B.4
5.
MULTIPLE CHOICE QUESTION
30 sec • 1 pt
What does the y-axis represent in the distance vs. time graph?
Time in minutes
Distance from home in miles
Speed in miles per hour
Temperature in degrees
Tags
CCSS.8.EE.B.5
6.
MULTIPLE CHOICE QUESTION
30 sec • 1 pt
At the start of the distance vs. time graph, where is the person located?
At home
6 miles from home
At a friend's house
4 miles from home
Tags
CCSS.HSF.IF.B.4
7.
MULTIPLE CHOICE QUESTION
30 sec • 1 pt
What does a flat line on the distance vs. time graph indicate?
The person is moving away from home
The person is moving towards home
The person is stationary
The person is changing direction
Tags
CCSS.8.EE.B.5
Access all questions and much more by creating a free account
Create resources
Host any resource
Get auto-graded reports
Continue with Google

Continue with Email
Continue with Microsoft
or continue with

%20(1).png)
Apple
Others
Already have an account?
