Exploring Tape Diagrams for Ratio and Rate Problems
Interactive Video
•
Mathematics
•
6th - 10th Grade
•
Practice Problem
•
Hard
+2
Standards-aligned

Mia Campbell
FREE Resource
Standards-aligned
10 questions
Show all answers
1.
MULTIPLE CHOICE QUESTION
30 sec • 1 pt
What visual model is introduced to solve ratio and rate problems?
Bar Graphs
Tape Diagrams
Line Graphs
Pie Charts
Tags
CCSS.5.NF.B.3
2.
MULTIPLE CHOICE QUESTION
30 sec • 1 pt
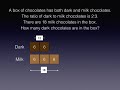
In the context problem, what is the ratio of dark to milk chocolates?
3 to 5
2 to 3
3 to 2
1 to 2
Tags
CCSS.6.RP.A.1
CCSS.6.RP.A.2
3.
MULTIPLE CHOICE QUESTION
30 sec • 1 pt
If each block in the tape diagram represents one chocolate, how many chocolates are there in the box?
5
10
3
2
Tags
CCSS.2.OA.A.1
4.
MULTIPLE CHOICE QUESTION
30 sec • 1 pt
If each block in the tape diagram represents two chocolates, how many chocolates are there in the box?
5
20
10
15
Tags
CCSS.2.OA.A.1
5.
MULTIPLE CHOICE QUESTION
30 sec • 1 pt
Given 18 milk chocolates and a ratio of 2 to 3, how many dark chocolates are there?
15
6
9
12
6.
MULTIPLE CHOICE QUESTION
30 sec • 1 pt
How many blocks represent the milk chocolates in the given problem with 18 milk chocolates?
5
4
3
2
Tags
CCSS.2.OA.A.1
7.
MULTIPLE CHOICE QUESTION
30 sec • 1 pt
If each block represents 6 chocolates, how many chocolates do the dark blocks represent in total?
18
24
12
6
Tags
CCSS.1.NBT.A.1
Access all questions and much more by creating a free account
Create resources
Host any resource
Get auto-graded reports
Continue with Google

Continue with Email
Continue with Classlink
Continue with Clever
or continue with
Microsoft
%20(1).png)
Apple
Others
Already have an account?
