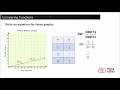
Comparing Functions: Graphs and Equations
Interactive Video
•
Mathematics
•
6th - 10th Grade
•
Practice Problem
•
Medium
+1
Standards-aligned

Emma Peterson
Used 11+ times
FREE Resource
Standards-aligned
10 questions
Show all answers
1.
MULTIPLE CHOICE QUESTION
30 sec • 1 pt
What is the main focus of this lesson?
Comparing functions represented graphically or as equations
Exploring polynomial functions
Understanding trigonometric functions
Learning about quadratic equations
Tags
CCSS.8.F.A.2
CCSS.HSF.IF.C.9
2.
MULTIPLE CHOICE QUESTION
30 sec • 1 pt
What does the y-axis represent in Mike's graph?
Slope of the function
Distance in miles
Time in minutes
Speed in miles per minute
Tags
CCSS.8.EE.B.5
3.
MULTIPLE CHOICE QUESTION
30 sec • 1 pt
How do you calculate the slope of Mike's graph?
Change in X divided by change in Y
Change in Y divided by change in X
Sum of X and Y values
Difference between X and Y values
Tags
CCSS.8.EE.B.5
4.
MULTIPLE CHOICE QUESTION
30 sec • 1 pt
What is the slope of Mike's graph?
1/16
20
16
1/20
Tags
CCSS.8.EE.B.5
5.
MULTIPLE CHOICE QUESTION
30 sec • 1 pt
What does a positive slope indicate in a graph?
The graph is constant
The graph is decreasing
The graph is non-linear
The graph is increasing
Tags
CCSS.8.EE.B.5
6.
MULTIPLE CHOICE QUESTION
30 sec • 1 pt
What is the slope of Carol's graph?
1/16
1/20
20
16
Tags
CCSS.8.EE.B.5
7.
MULTIPLE CHOICE QUESTION
30 sec • 1 pt
How long does it take Carol to walk one mile?
40 minutes
20 minutes
16 minutes
48 minutes
Tags
CCSS.HSF-LE.A.1B
Access all questions and much more by creating a free account
Create resources
Host any resource
Get auto-graded reports
Continue with Google

Continue with Email
Continue with Classlink
Continue with Clever
or continue with
Microsoft
%20(1).png)
Apple
Others
Already have an account?
Popular Resources on Wayground

15 questions
Fractions on a Number Line
Quiz
•
3rd Grade
20 questions
Equivalent Fractions
Quiz
•
3rd Grade
25 questions
Multiplication Facts
Quiz
•
5th Grade
54 questions
Analyzing Line Graphs & Tables
Quiz
•
4th Grade
22 questions
fractions
Quiz
•
3rd Grade
20 questions
Main Idea and Details
Quiz
•
5th Grade
20 questions
Context Clues
Quiz
•
6th Grade
15 questions
Equivalent Fractions
Quiz
•
4th Grade
Discover more resources for Mathematics
22 questions
distributive property
Quiz
•
7th Grade
18 questions
Angle Relationships
Quiz
•
7th Grade
15 questions
Distributive Property & Review
Quiz
•
6th Grade
20 questions
Writing Algebraic Expressions
Quiz
•
6th Grade
20 questions
How Some Friendships Last — and Others Don’t Video Questions
Quiz
•
7th Grade
14 questions
finding slope from a graph
Quiz
•
8th Grade
20 questions
Ratios/Rates and Unit Rates
Quiz
•
6th Grade
18 questions
Handbook Refresher Quiz
Quiz
•
7th Grade