Exploring Reading Graphs from May 13
Interactive Video
•
Mathematics
•
6th - 10th Grade
•
Practice Problem
•
Hard
+3
Standards-aligned

Aiden Montgomery
FREE Resource
Standards-aligned
10 questions
Show all answers
1.
MULTIPLE CHOICE QUESTION
30 sec • 1 pt
What is the main task for students on Friday?
Creating new graphs
Answering everyone's survey
Completing a math test
Writing an essay
Tags
CCSS.6.SP.B.5A
2.
MULTIPLE CHOICE QUESTION
30 sec • 1 pt
What type of data is best represented by line graphs?
Data showing proportions
Data showing change over time
Numerical data
Categorical data
3.
MULTIPLE CHOICE QUESTION
30 sec • 1 pt
Which type of bar graph is used to compare two or more items?
Double bar graph
Stacked bar graph
Horizontal bar graph
Frequency bar graph
Tags
CCSS.3.MD.B.3
4.
MULTIPLE CHOICE QUESTION
30 sec • 1 pt
What is the key difference between a histogram and a bar graph?
Bar graphs show changes over time
Histograms use colors
Bar graphs are always vertical
Histograms represent ranges of data
Tags
CCSS.6.SP.B.4
CCSS.HSS.ID.A.1
5.
MULTIPLE CHOICE QUESTION
30 sec • 1 pt
What does the median represent in a box-and-whisker plot?
The highest value
The lowest value
The middle value
The average value
Tags
CCSS.6.SP.B.4
CCSS.HSS.ID.A.1
6.
MULTIPLE CHOICE QUESTION
30 sec • 1 pt
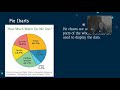
What does a pie chart represent?
A range of data
Comparative data
A whole divided into parts
Changes over time
7.
MULTIPLE CHOICE QUESTION
30 sec • 1 pt
In a line plot, what does an 'X' or a dot represent?
A category
A frequency
A range
A percentage
Tags
CCSS.6.SP.B.4
CCSS.HSS.ID.A.1
Access all questions and much more by creating a free account
Create resources
Host any resource
Get auto-graded reports
Continue with Google

Continue with Email
Continue with Microsoft
or continue with

%20(1).png)
Apple
Others
Already have an account?
