Exploring Scatter Plots and Correlation
Interactive Video
•
Mathematics
•
6th - 10th Grade
•
Practice Problem
•
Hard
+4
Standards-aligned

Olivia Brooks
FREE Resource
Standards-aligned
10 questions
Show all answers
1.
MULTIPLE CHOICE QUESTION
30 sec • 1 pt
What is a scatter plot?
A diagram that shows the flow of data
A table that lists data points
A chart that displays data in a circular format
A graph that shows the relationship between two sets of data
Tags
CCSS.8.SP.A.1
2.
MULTIPLE CHOICE QUESTION
30 sec • 1 pt
In which quadrant are most scatter plots found?
Second quadrant
Fourth quadrant
First quadrant
Third quadrant
Tags
CCSS.8.F.A.1
CCSS.HSF.IF.B.5
3.
MULTIPLE CHOICE QUESTION
30 sec • 1 pt
What is univariate data?
Data with one variable
Data with two variables
Data with three variables
Data with no variables
4.
MULTIPLE CHOICE QUESTION
30 sec • 1 pt
Which of the following is an example of bivariate data?
The atomic weight of calcium
The height and weight of a mammal
The price of high-speed internet from different companies
The number of students in a class
Tags
CCSS.6.SP.B.5A
5.
MULTIPLE CHOICE QUESTION
30 sec • 1 pt
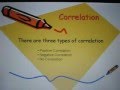
What type of correlation exists when both X and Y values increase together?
No correlation
Inverse correlation
Negative correlation
Positive correlation
Tags
CCSS.HSS.ID.B.5
6.
MULTIPLE CHOICE QUESTION
30 sec • 1 pt
Which of the following is an example of negative correlation?
The daily snowfall and the amount of shovels sold
The more time you spend studying, the higher your test scores
The month you were born and your birth weight
The older a car gets, the less it is worth
Tags
CCSS.HSF-LE.A.1B
7.
MULTIPLE CHOICE QUESTION
30 sec • 1 pt
What type of correlation is shown when there is no pattern in the data points?
Positive correlation
Negative correlation
No correlation
Inverse correlation
Tags
CCSS.HSS.ID.B.5
Access all questions and much more by creating a free account
Create resources
Host any resource
Get auto-graded reports
Continue with Google

Continue with Email
Continue with Classlink
Continue with Clever
or continue with
Microsoft
%20(1).png)
Apple
Others
Already have an account?
Popular Resources on Wayground

15 questions
Fractions on a Number Line
Quiz
•
3rd Grade
20 questions
Equivalent Fractions
Quiz
•
3rd Grade
25 questions
Multiplication Facts
Quiz
•
5th Grade
54 questions
Analyzing Line Graphs & Tables
Quiz
•
4th Grade
22 questions
fractions
Quiz
•
3rd Grade
20 questions
Main Idea and Details
Quiz
•
5th Grade
20 questions
Context Clues
Quiz
•
6th Grade
15 questions
Equivalent Fractions
Quiz
•
4th Grade
Discover more resources for Mathematics
22 questions
distributive property
Quiz
•
7th Grade
18 questions
Angle Relationships
Quiz
•
7th Grade
15 questions
Distributive Property & Review
Quiz
•
6th Grade
20 questions
Writing Algebraic Expressions
Quiz
•
6th Grade
20 questions
How Some Friendships Last — and Others Don’t Video Questions
Quiz
•
7th Grade
14 questions
finding slope from a graph
Quiz
•
8th Grade
20 questions
Ratios/Rates and Unit Rates
Quiz
•
6th Grade
18 questions
Handbook Refresher Quiz
Quiz
•
7th Grade