- Resource Library
- Math
- Data And Graphing
- Scatter Plot Correlation
- Exploring Scatterplots And Lines Of Best Fit
Exploring Scatterplots and Lines of Best Fit
Interactive Video
•
Mathematics
•
6th - 10th Grade
•
Practice Problem
•
Easy
+2
Standards-aligned

Olivia Brooks
Used 4+ times
FREE Resource
Standards-aligned
Read more
10 questions
Show all answers
1.
MULTIPLE CHOICE QUESTION
30 sec • 1 pt
What does a scatter plot show?
The difference between two variables
The average of two variables
The relationship between two variables
The sum of two variables
Tags
CCSS.8.SP.A.1
2.
MULTIPLE CHOICE QUESTION
30 sec • 1 pt
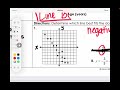
Which type of scatter plot shows dots going in an upward direction?
Negative
Positive
None of the above
No correlation
Tags
CCSS.HSS.ID.B.5
3.
MULTIPLE CHOICE QUESTION
30 sec • 1 pt
What is another term for 'no correlation' in a scatter plot?
Negative correlation
Positive correlation
Zero correlation
None
Tags
CCSS.HSS.ID.B.5
4.
MULTIPLE CHOICE QUESTION
30 sec • 1 pt
What is the purpose of a line of best fit?
To connect all the points
To go through the middle of most points
To show the highest point
To show the lowest point
Tags
CCSS.8.EE.B.5
5.
MULTIPLE CHOICE QUESTION
30 sec • 1 pt
What tool is recommended for graphing lines accurately?
A highlighter
A compass
A ruler
A pen
6.
MULTIPLE CHOICE QUESTION
30 sec • 1 pt
Which line color was used for Line A in the example?
Yellow
Green
Blue
Red
7.
MULTIPLE CHOICE QUESTION
30 sec • 1 pt
How do you determine if a correlation is positive or negative?
By checking if the dots are going up or down from left to right
By looking at the color of the dots
By measuring the distance between dots
By counting the number of dots
Tags
CCSS.HSS.ID.B.5
Access all questions and much more by creating a free account
Create resources
Host any resource
Get auto-graded reports
Continue with Google

Continue with Email
Continue with Microsoft
or continue with

%20(1).png)
Apple
Others
Already have an account?
