Comparing Box and Whisker Plots: Key Statistical Insights
Interactive Video
•
Mathematics
•
6th - 10th Grade
•
Practice Problem
•
Hard
+2
Standards-aligned

Olivia Brooks
FREE Resource
Standards-aligned
Read more
10 questions
Show all answers
1.
MULTIPLE CHOICE QUESTION
30 sec • 1 pt
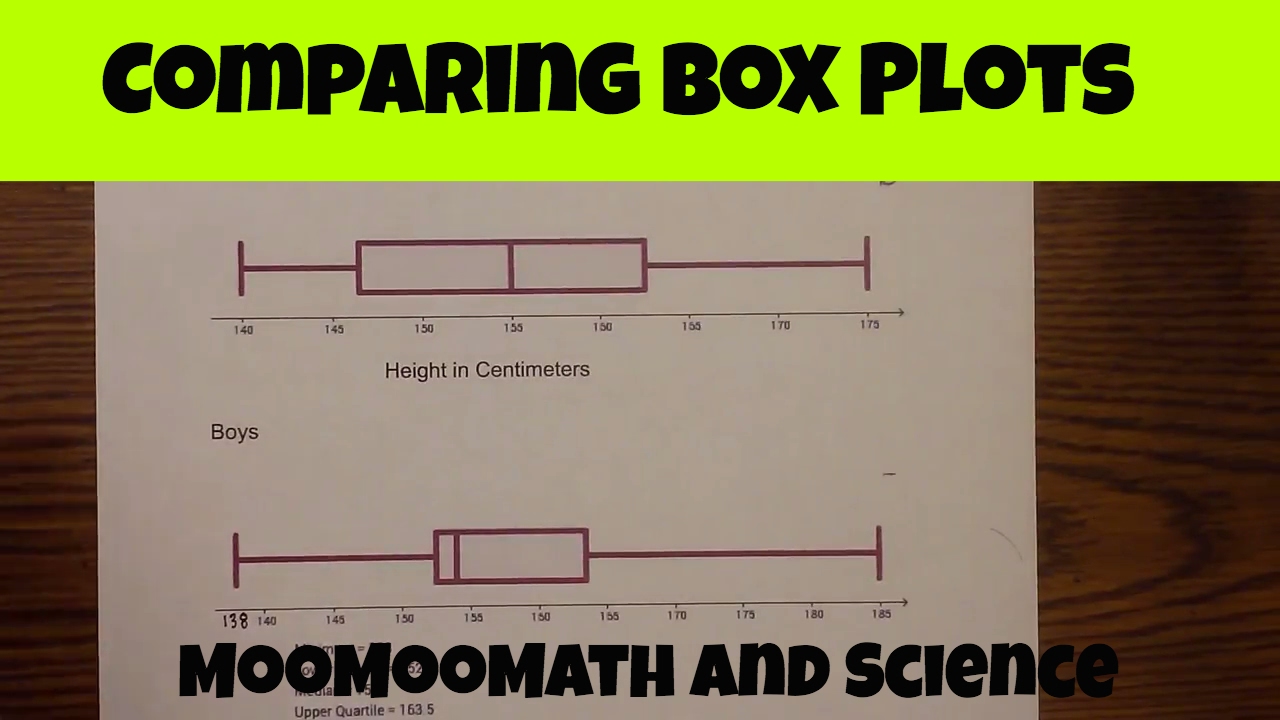
What percentage does each section of a box plot represent?
100%
75%
50%
25%
Tags
CCSS.6.SP.B.4
CCSS.HSS.ID.A.1
2.
MULTIPLE CHOICE QUESTION
30 sec • 1 pt
Why is it necessary for two box plots to be on the same scale when comparing them?
To make them look visually appealing
To ensure accuracy in comparison
To reduce the size of the plots
To increase the complexity of analysis
Tags
CCSS.HSS.ID.A.3
3.
MULTIPLE CHOICE QUESTION
30 sec • 1 pt
What is the purpose of comparing box plots?
To find the exact values of data
To visually represent and compare data distributions
To determine the mode of the data
To calculate the sum of all data points
Tags
CCSS.7.SP.B.4
4.
MULTIPLE CHOICE QUESTION
30 sec • 1 pt
Which gender had the shortest student according to the box plots?
Cannot be determined
Both had the same height
Males
Females
Tags
CCSS.6.SP.B.4
CCSS.HSS.ID.A.1
5.
MULTIPLE CHOICE QUESTION
30 sec • 1 pt
Which gender had the tallest student according to the box plots?
Cannot be determined
Females
Males
Both had the same height
Tags
CCSS.6.SP.B.4
CCSS.HSS.ID.A.1
6.
MULTIPLE CHOICE QUESTION
30 sec • 1 pt
What does a greater range in a box plot indicate?
Less variety in data
Data is inconclusive
More consistency in data
Greater variety in data
Tags
CCSS.6.SP.B.4
CCSS.HSS.ID.A.1
7.
MULTIPLE CHOICE QUESTION
30 sec • 1 pt
Which gender had a greater variety of heights?
Cannot be determined
Males
Females
Both had the same variety
Tags
CCSS.6.SP.B.5B
Access all questions and much more by creating a free account
Create resources
Host any resource
Get auto-graded reports
Continue with Google

Continue with Email
Continue with Classlink
Continue with Clever
or continue with
Microsoft
%20(1).png)
Apple
Others
Already have an account?
