- Resource Library
- Math
- Data And Graphing
- Scatter Plot Correlation
- Exploring Scatter Plots And Correlation
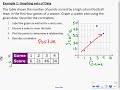
Exploring Scatter Plots and Correlation
Interactive Video
•
Mathematics
•
6th - 10th Grade
•
Practice Problem
•
Hard
+5
Standards-aligned

Aiden Montgomery
FREE Resource
Standards-aligned
Read more
10 questions
Show all answers
1.
MULTIPLE CHOICE QUESTION
30 sec • 1 pt
What is the main focus of Chapter 3?
Bar charts and histograms
Scatter plots, trend lines, and correlation
Pie charts and line graphs
Box plots and whisker plots
Tags
CCSS.6.SP.B.4
CCSS.HSS.ID.A.1
2.
MULTIPLE CHOICE QUESTION
30 sec • 1 pt
What does a positive correlation indicate?
There is no relationship between the variables
The variables are inversely proportional
As one variable increases, the other decreases
As one variable increases, the other also increases
Tags
CCSS.HSS.ID.B.5
3.
MULTIPLE CHOICE QUESTION
30 sec • 1 pt
What does a negative correlation mean?
As one variable increases, the other decreases
There is no relationship between the variables
The variables are directly proportional
As one variable increases, the other also increases
Tags
CCSS.HSS.ID.B.5
4.
MULTIPLE CHOICE QUESTION
30 sec • 1 pt
In the football team example, what is plotted on the x-axis?
The time of the game
The number of players
The number of games
The score
Tags
CCSS.8.EE.B.5
5.
MULTIPLE CHOICE QUESTION
30 sec • 1 pt
What is the correlation between the number of games and the score in the football team example?
No correlation
Negative correlation
Inverse correlation
Positive correlation
Tags
CCSS.HSS.ID.B.5
6.
MULTIPLE CHOICE QUESTION
30 sec • 1 pt
What is the likely correlation between a runner's time and the number of letters in their name?
Positive correlation
Negative correlation
No correlation
Inverse correlation
Tags
CCSS.HSS.ID.B.5
7.
MULTIPLE CHOICE QUESTION
30 sec • 1 pt
What is the purpose of a trend line in a scatter plot?
To split the data points into two equal halves
To show the average value of the data points
To predict future values based on the trend
To connect all the data points
Tags
CCSS.8.SP.A.2
Access all questions and much more by creating a free account
Create resources
Host any resource
Get auto-graded reports
Continue with Google

Continue with Email
Continue with Microsoft
or continue with

%20(1).png)
Apple
Others
Already have an account?
