Exploring Dot Plots and Frequency Tables
Interactive Video
•
Mathematics
•
6th - 10th Grade
•
Practice Problem
•
Hard
+4
Standards-aligned

Olivia Brooks
FREE Resource
Standards-aligned
10 questions
Show all answers
1.
MULTIPLE CHOICE QUESTION
30 sec • 1 pt
What type of data representation uses a number line and dots?
Dot plot
Pie chart
Histogram
Bar graph
2.
MULTIPLE CHOICE QUESTION
30 sec • 1 pt
Which lengths of iguanas were most common in the sample?
17 inches
15 inches
12 and 18 inches
14 and 16 inches
Tags
CCSS.2.MD.D.9
3.
MULTIPLE CHOICE QUESTION
30 sec • 1 pt
What is the purpose of a frequency table?
To display data in a pie chart
To compare two sets of data
To organize data by how often something occurs
To show data on a number line
4.
MULTIPLE CHOICE QUESTION
30 sec • 1 pt
How many quiz grades were recorded at 85?
Three
Two
Four
One
Tags
CCSS.6.SP.B.5A
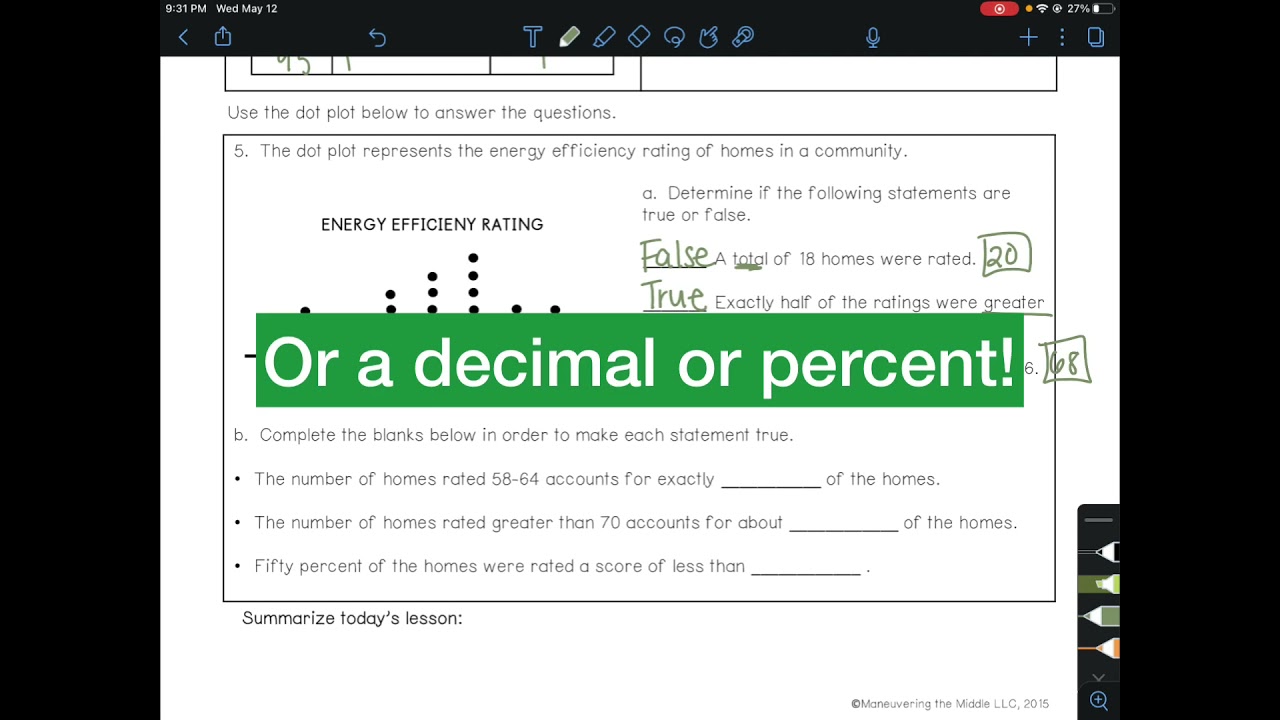
5.
MULTIPLE CHOICE QUESTION
30 sec • 1 pt
What was the most common energy efficiency rating?
68
70
66
72
Tags
CCSS.6.SP.B.5A
6.
MULTIPLE CHOICE QUESTION
30 sec • 1 pt
How many homes had an energy efficiency rating greater than 70?
5
4
3
2
Tags
CCSS.2.MD.D.9
7.
MULTIPLE CHOICE QUESTION
30 sec • 1 pt
What fraction of homes had a rating between 58 to 64?
3/20
10/20
15/20
6/20
Tags
CCSS.3.NF.A.1
CCSS.3.NF.A.2B
Access all questions and much more by creating a free account
Create resources
Host any resource
Get auto-graded reports
Continue with Google

Continue with Email
Continue with Microsoft
or continue with

%20(1).png)
Apple
Others
Already have an account?
