Exploring Pictographs and Bar Graphs in 2nd Grade Math
Interactive Video
•
Mathematics
•
6th - 10th Grade
•
Practice Problem
•
Medium
Standards-aligned

Ethan Morris
Used 4+ times
FREE Resource
Standards-aligned
Read more
10 questions
Show all answers
1.
MULTIPLE CHOICE QUESTION
30 sec • 1 pt
What does a pictograph use to represent data?
Graphs and charts
Words and sentences
Pictures or symbols
Numbers and letters
Tags
CCSS.2.MD.D.10
2.
MULTIPLE CHOICE QUESTION
30 sec • 1 pt
What is the main purpose of using pictographs?
To visually represent data using pictures
To make data hard to understand
To write detailed reports
To represent data numerically
Tags
CCSS.2.MD.D.10
3.
MULTIPLE CHOICE QUESTION
30 sec • 1 pt
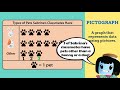
How many of Sabrina's classmates have rabbits as pets?
4
3
6
8
Tags
CCSS.1.MD.C.4
4.
MULTIPLE CHOICE QUESTION
30 sec • 1 pt
How many paw prints represent dogs in the pictograph?
6
8
3
4
Tags
CCSS.1.MD.C.4
5.
MULTIPLE CHOICE QUESTION
30 sec • 1 pt
Which pet is the most popular among Sabrina's classmates?
Rabbits
Other
Dogs
Cats
Tags
CCSS.2.MD.D.10
6.
MULTIPLE CHOICE QUESTION
30 sec • 1 pt
What does each smiley face represent in the pictograph about favorite subjects?
Three students
Two students
Four students
One student
Tags
CCSS.1.MD.C.4
7.
MULTIPLE CHOICE QUESTION
30 sec • 1 pt
How many students like math, according to the pictograph?
8
16
10
12
Tags
CCSS.1.MD.C.4
Access all questions and much more by creating a free account
Create resources
Host any resource
Get auto-graded reports
Continue with Google

Continue with Email
Continue with Microsoft
or continue with

%20(1).png)
Apple
Others
Already have an account?
