Exploring Tally Charts and Data Collection
Interactive Video
•
Mathematics
•
6th - 10th Grade
•
Practice Problem
•
Hard
+2
Standards-aligned

Liam Anderson
Used 1+ times
FREE Resource
Standards-aligned
Read more
10 questions
Show all answers
1.
MULTIPLE CHOICE QUESTION
30 sec • 1 pt
What is data typically composed of?
Graphical symbols only
Only numbers
Only words
Both numbers and words
Tags
CCSS.1.MD.C.4
2.
MULTIPLE CHOICE QUESTION
30 sec • 1 pt
How are tally marks grouped when counting?
In groups of six
In groups of three
In groups of five
In groups of four
Tags
CCSS.2.OA.C.3
3.
MULTIPLE CHOICE QUESTION
30 sec • 1 pt
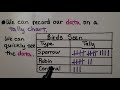
Which bird was observed the most according to the tally chart?
Eagle
Cardinal
Robin
Sparrow
Tags
CCSS.1.MD.C.4
4.
MULTIPLE CHOICE QUESTION
30 sec • 1 pt
In the ice cream survey, which flavor was more popular?
Mint
Vanilla
Chocolate
Strawberry
Tags
CCSS.2.MD.D.10
5.
MULTIPLE CHOICE QUESTION
30 sec • 1 pt
How many students did not participate in the ice cream survey?
6
2
8
4
Tags
CCSS.6.SP.B.5A
6.
MULTIPLE CHOICE QUESTION
30 sec • 1 pt
Which bracelet color sold the least according to Sarah's tally chart?
Green
Blue
Red
Yellow
Tags
CCSS.2.MD.D.9
7.
MULTIPLE CHOICE QUESTION
30 sec • 1 pt
According to the pets survey, which pet do fewer students have?
Fish
Dog
Cat
Bird
Tags
CCSS.2.MD.D.9
Access all questions and much more by creating a free account
Create resources
Host any resource
Get auto-graded reports
Continue with Google

Continue with Email
Continue with Classlink
Continue with Clever
or continue with
Microsoft
%20(1).png)
Apple
Others
Already have an account?
