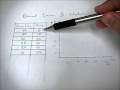
Understanding Demand Curves and Schedules
Interactive Video
•
Mathematics, Business, Science
•
8th - 12th Grade
•
Practice Problem
•
Hard
Standards-aligned

Olivia Brooks
FREE Resource
Standards-aligned
Read more
7 questions
Show all answers
1.
MULTIPLE CHOICE QUESTION
30 sec • 1 pt
What is the primary relationship depicted in a demand schedule?
The relationship between supply and demand
The relationship between quantity and price
The relationship between cost and revenue
The relationship between profit and loss
2.
MULTIPLE CHOICE QUESTION
30 sec • 1 pt
If the price of a product is zero, how many units are demanded according to the example?
40 units
80 units
60 units
100 units
3.
MULTIPLE CHOICE QUESTION
30 sec • 1 pt
At a price of 20, what is the quantity demanded in the given example?
80 units
20 units
60 units
40 units
Tags
CCSS.8.F.B.4
CCSS.HSF.IF.B.6
4.
MULTIPLE CHOICE QUESTION
30 sec • 1 pt
What happens to the quantity demanded as the price increases from 10 to 20?
It fluctuates
It decreases
It remains the same
It increases
Tags
CCSS.8.EE.B.5
5.
MULTIPLE CHOICE QUESTION
30 sec • 1 pt
How do you plot the demand schedule on a graph?
By drawing a straight line
By using a pie chart
By using a bar chart
By connecting the price and quantity pairs with dots
6.
MULTIPLE CHOICE QUESTION
30 sec • 1 pt
What is the quantity demanded at a price of 30?
40 units
0 units
20 units
60 units
Tags
CCSS.8.EE.B.5
7.
MULTIPLE CHOICE QUESTION
30 sec • 1 pt
What is the shape of the demand curve?
Downward sloping
Upward sloping
Horizontal
Vertical
Tags
CCSS.8.EE.B.5
Access all questions and much more by creating a free account
Create resources
Host any resource
Get auto-graded reports
Continue with Google

Continue with Email
Continue with Classlink
Continue with Clever
or continue with
Microsoft
%20(1).png)
Apple
Others
Already have an account?
