Creating and Interpreting Histograms
Interactive Video
•
Mathematics
•
6th - 10th Grade
•
Practice Problem
•
Medium
+2
Standards-aligned

Jackson Turner
Used 42+ times
FREE Resource
Standards-aligned
Read more
10 questions
Show all answers
1.
MULTIPLE CHOICE QUESTION
30 sec • 1 pt
What is a histogram?
A type of graph showing frequencies of different values in a dataset.
A pie chart showing different categories.
A line graph showing trends over time.
A map showing geographical data.
Tags
CCSS.6.SP.B.4
CCSS.HSS.ID.A.1
2.
MULTIPLE CHOICE QUESTION
30 sec • 1 pt
What can be an example of data for creating a histogram?
Number of books read by students.
Favorite color of students.
Names of students in a class.
List of countries visited.
Tags
CCSS.6.SP.B.4
CCSS.HSS.ID.A.1
3.
MULTIPLE CHOICE QUESTION
30 sec • 1 pt
What does the horizontal axis in a histogram represent?
Percentage of total data.
Frequency of occurrences.
Time period.
Range of values in the dataset.
Tags
CCSS.6.SP.B.4
CCSS.HSS.ID.A.1
4.
MULTIPLE CHOICE QUESTION
30 sec • 1 pt
What does the vertical axis in a histogram represent?
Time period.
Percentage of total data.
Frequency of occurrences.
Range of values in the dataset.
Tags
CCSS.6.SP.B.4
CCSS.HSS.ID.A.1
5.
MULTIPLE CHOICE QUESTION
30 sec • 1 pt
How are the bars in a histogram positioned in relation to each other?
They overlap slightly.
They are arranged in ascending order.
They touch each other unless there's a range with zero frequency.
They are spaced evenly apart.
Tags
CCSS.5.G.A.2
6.
MULTIPLE CHOICE QUESTION
30 sec • 1 pt
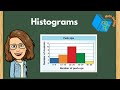
What color bar was used to represent the students who completed between 20 and 29 push-ups?
Green
Red
Orange
Blue
Tags
CCSS.2.MD.D.9
CCSS.3.MD.B.4
7.
MULTIPLE CHOICE QUESTION
30 sec • 1 pt
Which range had the highest number of students completing push-ups?
10 to 19
20 to 29
30 to 39
0 to 9
Tags
CCSS.5.G.A.2
Access all questions and much more by creating a free account
Create resources
Host any resource
Get auto-graded reports
Continue with Google

Continue with Email
Continue with Microsoft
or continue with

%20(1).png)
Apple
Others
Already have an account?
