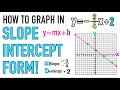
Graphing Linear Functions in Slope Intercept Form
Interactive Video
•
Mathematics
•
6th - 10th Grade
•
Practice Problem
•
Medium
+6
Standards-aligned

Lucas Foster
Used 22+ times
FREE Resource
Standards-aligned
Read more
10 questions
Show all answers
1.
MULTIPLE CHOICE QUESTION
30 sec • 1 pt
What does f(x) represent in a function?
The y-intercept of the function
The input of the function
The output of the function
The slope of the function
Tags
CCSS.8.F.A.1
CCSS.HSF.IF.A.1
2.
MULTIPLE CHOICE QUESTION
30 sec • 1 pt
What form is used to make graphing easier?
Quadratic form
Slope-intercept form
Standard form
Point-slope form
3.
MULTIPLE CHOICE QUESTION
30 sec • 1 pt
What does a negative slope indicate about the direction of the line?
It descends from left to right
It is vertical
It ascends from left to right
It is horizontal
Tags
CCSS.8.EE.B.5
4.
MULTIPLE CHOICE QUESTION
30 sec • 1 pt
Where does the graph of the function hit the y-axis?
At positive 3
At negative 2
At positive 2
At negative 3
Tags
CCSS.HSF-IF.C.7A
5.
MULTIPLE CHOICE QUESTION
30 sec • 1 pt
What is the next step after plotting the y-intercept on the graph?
Draw the line
Plot the x-intercept
Label the axes
Plot another point using the slope
6.
MULTIPLE CHOICE QUESTION
30 sec • 1 pt
How do you interpret the slope of -3/4 in terms of rise over run?
Rise 4 units up, run 3 units right
Rise 4 units down, run 3 units right
Rise 3 units up, run 4 units right
Rise 3 units down, run 4 units right
Tags
CCSS.8.EE.B.5
7.
MULTIPLE CHOICE QUESTION
30 sec • 1 pt
How can you ensure the points are aligned correctly on the graph?
By using a ruler
By checking the slope
By plotting at least three points
By measuring the distance between points
Access all questions and much more by creating a free account
Create resources
Host any resource
Get auto-graded reports
Continue with Google

Continue with Email
Continue with Classlink
Continue with Clever
or continue with
Microsoft
%20(1).png)
Apple
Others
Already have an account?
Popular Resources on Wayground

15 questions
Fractions on a Number Line
Quiz
•
3rd Grade
10 questions
Probability Practice
Quiz
•
4th Grade
15 questions
Probability on Number LIne
Quiz
•
4th Grade
20 questions
Equivalent Fractions
Quiz
•
3rd Grade
25 questions
Multiplication Facts
Quiz
•
5th Grade
22 questions
fractions
Quiz
•
3rd Grade
6 questions
Appropriate Chromebook Usage
Lesson
•
7th Grade
10 questions
Greek Bases tele and phon
Quiz
•
6th - 8th Grade
Discover more resources for Mathematics
20 questions
Writing Algebraic Expressions
Quiz
•
6th Grade
20 questions
Ratios/Rates and Unit Rates
Quiz
•
6th Grade
14 questions
Volume of rectangular prisms
Quiz
•
7th Grade
23 questions
TSI Math Vocabulary
Quiz
•
10th - 12th Grade
15 questions
Graphing Inequalities
Quiz
•
7th - 9th Grade
20 questions
Graphing Inequalities on a Number Line
Quiz
•
6th - 9th Grade
20 questions
One Step Equations
Quiz
•
6th Grade
12 questions
One-Step Equations
Quiz
•
6th Grade