- Resource Library
- Math
- Percents, Ratios, And Rates
- Constant Of Proportionality
- Identifying The Constant Of Proportionality
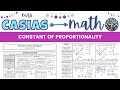
Identifying the Constant of Proportionality
Interactive Video
•
Mathematics
•
6th - 10th Grade
•
Practice Problem
•
Medium
Standards-aligned

Olivia Brooks
Used 13+ times
FREE Resource
Standards-aligned
Read more
10 questions
Show all answers
1.
MULTIPLE CHOICE QUESTION
30 sec • 1 pt
What symbol is used to represent the constant of proportionality?
C
K
Y
X
Tags
CCSS.7.RP.A.2C
2.
MULTIPLE CHOICE QUESTION
30 sec • 1 pt
What does the constant of proportionality tell us in a proportional relationship?
The ratio of Y to X for all points in the relationship
The difference between each X and Y value
The product of all X and Y values
The sum of all X and Y values
Tags
CCSS.7.RP.A.2B
3.
MULTIPLE CHOICE QUESTION
30 sec • 1 pt
How do you find the constant of proportionality from a table?
Add Y to X
Divide Y by X
Subtract X from Y
Multiply Y by X
Tags
CCSS.7.RP.A.2B
4.
MULTIPLE CHOICE QUESTION
30 sec • 1 pt
What is the constant of proportionality if 4 hours of babysitting earns $48?
4
8
24
12
Tags
CCSS.7.RP.A.2B
5.
MULTIPLE CHOICE QUESTION
30 sec • 1 pt
What equation represents a proportional relationship where K is 55?
y = 55 + x
y = x - 55
y = x/55
y = 55x
Tags
CCSS.7.RP.A.2C
6.
MULTIPLE CHOICE QUESTION
30 sec • 1 pt
In a graph, how do you determine the constant of proportionality?
Divide Y by X using any ordered pair
Multiply X by Y using any ordered pair
Subtract Y from X using the first ordered pair
Add all X values and divide by total Y values
Tags
CCSS.7.RP.A.2B
7.
MULTIPLE CHOICE QUESTION
30 sec • 1 pt
What does a constant of proportionality of 4 in a graph indicate?
For every 4 increases in X, Y increases by 1
For every 1 increase in X, Y increases by 4
For every 4 increases in X, Y decreases by 1
For every 1 increase in X, Y decreases by 4
Tags
CCSS.7.RP.A.2D
Access all questions and much more by creating a free account
Create resources
Host any resource
Get auto-graded reports
Continue with Google

Continue with Email
Continue with Classlink
Continue with Clever
or continue with
Microsoft
%20(1).png)
Apple
Others
Already have an account?
