Adding and Subtracting Rational Expressions
Interactive Video
•
Mathematics
•
6th - 10th Grade
•
Practice Problem
•
Hard
+1
Standards-aligned

Aiden Montgomery
Used 2+ times
FREE Resource
Standards-aligned
Read more
10 questions
Show all answers
1.
MULTIPLE CHOICE QUESTION
30 sec • 1 pt
What is the primary purpose of the line of best fit?
To accurately predict future data points
To draw a line that is close to most of the data points
To connect all the data points on a scatterplot
To calculate the exact values of all data points
Tags
CCSS.8.EE.B.5
2.
MULTIPLE CHOICE QUESTION
30 sec • 1 pt
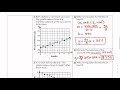
What is the y-intercept of Line A?
90
70
50
20
3.
MULTIPLE CHOICE QUESTION
30 sec • 1 pt
How is the slope of Line B different from Line A?
Line B's slope is negative while Line A's is positive
Line B and Line A have the same slope
Line B has a more gradual slope
Line B has a steeper slope
Tags
CCSS.8.F.A.2
CCSS.HSF.IF.C.9
4.
MULTIPLE CHOICE QUESTION
30 sec • 1 pt
Which line was ultimately determined as the best fit?
Line A
Line D
Line B
Line C
Tags
CCSS.8.EE.B.5
5.
MULTIPLE CHOICE QUESTION
30 sec • 1 pt
What is the first step in finding the line of best fit?
Calculate the slope
Identify the y-intercept
Draw a line close to most data points
Write the equation in slope-intercept form
Tags
CCSS.8.EE.B.5
6.
MULTIPLE CHOICE QUESTION
30 sec • 1 pt
How is the y-intercept determined in the process of finding the line of best fit?
By calculating the average of all y-values
By using the slope formula
By identifying where the line crosses the y-axis
By plotting all data points first
Tags
CCSS.8.EE.B.5
7.
MULTIPLE CHOICE QUESTION
30 sec • 1 pt
What was used to estimate the weight of a baby at 12 months?
The baby's height
The line of best fit
The number of data points
The baby's age in weeks
Tags
CCSS.8.EE.B.5
Access all questions and much more by creating a free account
Create resources
Host any resource
Get auto-graded reports
Continue with Google

Continue with Email
Continue with Microsoft
or continue with

%20(1).png)
Apple
Others
Already have an account?
