Exploring Stem and Leaf Plots
Interactive Video
•
Mathematics
•
6th - 8th Grade
•
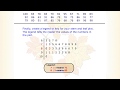
Practice Problem
•
Hard

Mia Campbell
FREE Resource
5 questions
Show all answers
1.
MULTIPLE CHOICE QUESTION
30 sec • 1 pt
What is the primary use of a stem-and-leaf plot?
To create graphical representations like pie charts
To organize large sets of numerical data
To solve algebraic equations
To calculate statistical measures like mean and median
2.
MULTIPLE CHOICE QUESTION
30 sec • 1 pt
In a stem-and-leaf plot, what does the 'stem' typically represent?
The last digit of each data point
The lowest value in the data set
The first digit of each data point
The highest value in the data set
3.
MULTIPLE CHOICE QUESTION
30 sec • 1 pt
How should the leaves be arranged in each row of a stem-and-leaf plot?
In descending order
Randomly
In ascending order
Based on their frequency
4.
MULTIPLE CHOICE QUESTION
30 sec • 1 pt
What does a stem of 3 and a leaf of 2 represent in a stem-and-leaf plot?
23
32
2.3
3.2
5.
MULTIPLE CHOICE QUESTION
30 sec • 1 pt
What is created when a stem-and-leaf plot is turned sideways?
A line graph
A bar graph
A histogram
A scatter plot
Access all questions and much more by creating a free account
Create resources
Host any resource
Get auto-graded reports
Continue with Google

Continue with Email
Continue with Classlink
Continue with Clever
or continue with
Microsoft
%20(1).png)
Apple
Others
Already have an account?
Popular Resources on Wayground

7 questions
History of Valentine's Day
Interactive video
•
4th Grade
15 questions
Fractions on a Number Line
Quiz
•
3rd Grade
20 questions
Equivalent Fractions
Quiz
•
3rd Grade
25 questions
Multiplication Facts
Quiz
•
5th Grade
22 questions
fractions
Quiz
•
3rd Grade
15 questions
Valentine's Day Trivia
Quiz
•
3rd Grade
20 questions
Main Idea and Details
Quiz
•
5th Grade
20 questions
Context Clues
Quiz
•
6th Grade
Discover more resources for Mathematics
20 questions
Writing Algebraic Expressions
Quiz
•
6th Grade
20 questions
Ratios/Rates and Unit Rates
Quiz
•
6th Grade
14 questions
Volume of rectangular prisms
Quiz
•
7th Grade
20 questions
Laws of Exponents
Quiz
•
8th Grade
20 questions
Graphing Inequalities on a Number Line
Quiz
•
6th - 9th Grade
20 questions
One Step Equations
Quiz
•
6th Grade
10 questions
Solving One Step Inequalities
Quiz
•
6th Grade
15 questions
Equivalent Ratios
Quiz
•
6th Grade