Exploring Double Stem and Leaf Plots
Interactive Video
•
Mathematics
•
6th - 8th Grade
•
Practice Problem
•
Hard
+1
Standards-aligned

Olivia Brooks
FREE Resource
Standards-aligned
Read more
8 questions
Show all answers
1.
MULTIPLE CHOICE QUESTION
30 sec • 1 pt
What is the purpose of using a double stem-and-leaf plot?
To compare three sets of data
To display data in a chronological order
To compare two sets of data on one graph
To calculate the mean of the data
Tags
CCSS.HSS.ID.A.3
2.
MULTIPLE CHOICE QUESTION
30 sec • 1 pt
What could the two sides of a double stem-and-leaf plot represent?
Different species in a study
Different geographical locations
Different temperature readings
Different classes or categories
3.
MULTIPLE CHOICE QUESTION
30 sec • 1 pt
What was the highest score in the test?
6
29
35
24
Tags
CCSS.6.SP.B.4
CCSS.HSS.ID.A.1
4.
MULTIPLE CHOICE QUESTION
30 sec • 1 pt
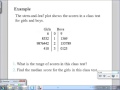
What was the range of scores in the test?
6
24
35
29
Tags
CCSS.6.SP.B.4
CCSS.HSS.ID.A.1
5.
MULTIPLE CHOICE QUESTION
30 sec • 1 pt
How do you find the median score in a set of data?
By adding all scores and dividing by the number of scores
By finding the middle score when data is ordered
By averaging the highest and lowest scores
By finding the most frequent score
Tags
CCSS.6.SP.B.5C
6.
MULTIPLE CHOICE QUESTION
30 sec • 1 pt
What was the median score for the girls in the test?
6
29
35
24
Tags
CCSS.6.SP.B.5C
7.
MULTIPLE CHOICE QUESTION
30 sec • 1 pt
Which group had a higher cluster of scores in the test?
Both scored the same
Data is inconclusive
Boys
Girls
Access all questions and much more by creating a free account
Create resources
Host any resource
Get auto-graded reports
Continue with Google

Continue with Email
Continue with Classlink
Continue with Clever
or continue with
Microsoft
%20(1).png)
Apple
Others
Already have an account?
Popular Resources on Wayground

7 questions
History of Valentine's Day
Interactive video
•
4th Grade
15 questions
Fractions on a Number Line
Quiz
•
3rd Grade
20 questions
Equivalent Fractions
Quiz
•
3rd Grade
25 questions
Multiplication Facts
Quiz
•
5th Grade
22 questions
fractions
Quiz
•
3rd Grade
15 questions
Valentine's Day Trivia
Quiz
•
3rd Grade
20 questions
Main Idea and Details
Quiz
•
5th Grade
20 questions
Context Clues
Quiz
•
6th Grade
Discover more resources for Mathematics
20 questions
Writing Algebraic Expressions
Quiz
•
6th Grade
20 questions
Ratios/Rates and Unit Rates
Quiz
•
6th Grade
14 questions
Volume of rectangular prisms
Quiz
•
7th Grade
20 questions
Laws of Exponents
Quiz
•
8th Grade
20 questions
Graphing Inequalities on a Number Line
Quiz
•
6th - 9th Grade
20 questions
One Step Equations
Quiz
•
6th Grade
10 questions
Solving One Step Inequalities
Quiz
•
6th Grade
15 questions
Equivalent Ratios
Quiz
•
6th Grade