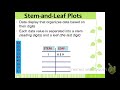
Exploring Stem-and-Leaf Plots
Interactive Video
•
Mathematics
•
6th - 8th Grade
•
Practice Problem
•
Hard

Lucas Foster
FREE Resource
Read more
8 questions
Show all answers
1.
MULTIPLE CHOICE QUESTION
30 sec • 1 pt
What is a primary advantage of using stem-and-leaf plots over other types of data displays?
They allow for better data manipulation.
They are easier to create.
They show the original data values.
They require less space.
2.
MULTIPLE CHOICE QUESTION
30 sec • 1 pt
What are the two parts into which data is split in a stem-and-leaf plot?
Stems and leaves
Stems and branches
Roots and leaves
Digits and numbers
3.
MULTIPLE CHOICE QUESTION
30 sec • 1 pt
In a stem-and-leaf plot, what does the stem typically represent?
The lowest value of data
The highest value of data
The leading digits of the numbers
The trailing digits of the numbers
4.
MULTIPLE CHOICE QUESTION
30 sec • 1 pt
What does the leaf in a stem-and-leaf plot represent?
The leading digits of the numbers
The trailing digits of the numbers
The total count of data points
The average value of the data
5.
MULTIPLE CHOICE QUESTION
30 sec • 1 pt
If a dataset includes the numbers 22, 22, and 24, how are these represented in the leaves?
As 4, 4, and 4
As 2, 2, and 2
As 2, 2, and 4
As 22, 22, and 24
6.
MULTIPLE CHOICE QUESTION
30 sec • 1 pt
How are repeated data points shown in the leaves of a stem-and-leaf plot?
By increasing the stem value
By listing the leaf multiple times
By underlining the repeated leaves
By placing a special symbol next to the leaf
7.
MULTIPLE CHOICE QUESTION
30 sec • 1 pt
What is the purpose of a key in a stem-and-leaf plot?
To identify the highest data point
To explain how to read the plot
To provide a title for the plot
To list all the data points
Access all questions and much more by creating a free account
Create resources
Host any resource
Get auto-graded reports
Continue with Google

Continue with Email
Continue with Classlink
Continue with Clever
or continue with
Microsoft
%20(1).png)
Apple
Others
Already have an account?
Popular Resources on Wayground

15 questions
Fractions on a Number Line
Quiz
•
3rd Grade
20 questions
Equivalent Fractions
Quiz
•
3rd Grade
25 questions
Multiplication Facts
Quiz
•
5th Grade
54 questions
Analyzing Line Graphs & Tables
Quiz
•
4th Grade
22 questions
fractions
Quiz
•
3rd Grade
20 questions
Main Idea and Details
Quiz
•
5th Grade
20 questions
Context Clues
Quiz
•
6th Grade
15 questions
Equivalent Fractions
Quiz
•
4th Grade
Discover more resources for Mathematics
22 questions
distributive property
Quiz
•
7th Grade
18 questions
Angle Relationships
Quiz
•
7th Grade
15 questions
Distributive Property & Review
Quiz
•
6th Grade
20 questions
Writing Algebraic Expressions
Quiz
•
6th Grade
20 questions
How Some Friendships Last — and Others Don’t Video Questions
Quiz
•
7th Grade
14 questions
finding slope from a graph
Quiz
•
8th Grade
20 questions
Ratios/Rates and Unit Rates
Quiz
•
6th Grade
18 questions
Handbook Refresher Quiz
Quiz
•
7th Grade