Unit Rate Analysis from Graphs
Interactive Video
•
Mathematics
•
6th - 8th Grade
•
Practice Problem
•
Hard
+5
Standards-aligned

Lucas Foster
FREE Resource
Standards-aligned
10 questions
Show all answers
1.
MULTIPLE CHOICE QUESTION
30 sec • 1 pt
What does the y-axis represent in the graph discussed?
Time
Speed
Miles
Days
Tags
CCSS.7.RP.A.2D
2.
MULTIPLE CHOICE QUESTION
30 sec • 1 pt
What axis is typically used for the independent variable in a graph?
y-axis
x-axis
z-axis
None
Tags
CCSS.8.F.A.1
CCSS.HSF.IF.B.5
3.
MULTIPLE CHOICE QUESTION
30 sec • 1 pt
If a graph point at x=1 shows y=10, what is the unit rate?
10 days per mile
1 mile per day
10 miles per day
1 day per mile
Tags
CCSS.7.RP.A.1
4.
MULTIPLE CHOICE QUESTION
30 sec • 1 pt
How do you determine the unit rate from a graph?
Divide y by x at any point
Multiply y by x
Add y to x
Subtract y from x
Tags
CCSS.7.RP.A.2D
5.
MULTIPLE CHOICE QUESTION
30 sec • 1 pt
What should you do if there is no point where x equals one on the graph?
Ignore the graph
Calculate using another point
Estimate the closest point
Restart the graph
Tags
CCSS.HSF.IF.A.2
6.
MULTIPLE CHOICE QUESTION
30 sec • 1 pt
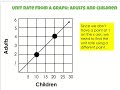
In a graph comparing adults to children, what does a point (10, 2) indicate?
2 children per adult
10 children per adult
2 adults per 10 children
10 adults per child
Tags
CCSS.7.RP.A.2D
7.
MULTIPLE CHOICE QUESTION
30 sec • 1 pt
What is the unit rate if the graph shows a point at (20, 4) for adults and children?
4 adults per 20 children
20 adults per child
4 children per adult
0.2 adults per child
Tags
CCSS.6.RP.A.1
CCSS.6.RP.A.2
Access all questions and much more by creating a free account
Create resources
Host any resource
Get auto-graded reports
Continue with Google

Continue with Email
Continue with Classlink
Continue with Clever
or continue with
Microsoft
%20(1).png)
Apple
Others
Already have an account?
