Comparing Boxplots in Statistics
Interactive Video
•
Mathematics
•
6th - 8th Grade
•
Practice Problem
•
Hard
+2
Standards-aligned

Liam Anderson
FREE Resource
Standards-aligned
Read more
10 questions
Show all answers
1.
MULTIPLE CHOICE QUESTION
30 sec • 1 pt
What statistical measure is represented by the middle bar in a boxplot?
Range
Mode
Median
Mean
Tags
CCSS.6.SP.B.4
CCSS.HSS.ID.A.1
2.
MULTIPLE CHOICE QUESTION
30 sec • 1 pt
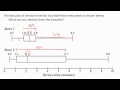
Which store has a smaller median serving time?
Store 1
Store 2
Both are the same
Data not available
Tags
CCSS.HSS.ID.A.3
3.
MULTIPLE CHOICE QUESTION
30 sec • 1 pt
What does a smaller median indicate about the store's service time?
Better quality food
Slower service
Faster service
More expensive service
Tags
CCSS.7.SP.B.4
4.
MULTIPLE CHOICE QUESTION
30 sec • 1 pt
Which store shows a wider range of service times?
Store 1
Store 2
Both show similar ranges
Cannot be determined
Tags
CCSS.6.SP.A.2
5.
MULTIPLE CHOICE QUESTION
30 sec • 1 pt
What does the large range in service times at Store 2 suggest about its service?
Low consistency
Faster service
High consistency
Higher quality
Tags
CCSS.7.SP.B.4
6.
MULTIPLE CHOICE QUESTION
30 sec • 1 pt
If consistency in service time is important, which store would be preferable?
Neither
Both are equally good
Store 2
Store 1
Tags
CCSS.7.SP.B.4
7.
MULTIPLE CHOICE QUESTION
30 sec • 1 pt
In the case of infants with SIRDS, which group generally had higher birthweights?
Infants who survived
Infants who did not survive
Both groups had similar weights
Data is inconclusive
Access all questions and much more by creating a free account
Create resources
Host any resource
Get auto-graded reports
Continue with Google

Continue with Email
Continue with Classlink
Continue with Clever
or continue with
Microsoft
%20(1).png)
Apple
Others
Already have an account?
Popular Resources on Wayground

7 questions
History of Valentine's Day
Interactive video
•
4th Grade
15 questions
Fractions on a Number Line
Quiz
•
3rd Grade
20 questions
Equivalent Fractions
Quiz
•
3rd Grade
25 questions
Multiplication Facts
Quiz
•
5th Grade
22 questions
fractions
Quiz
•
3rd Grade
15 questions
Valentine's Day Trivia
Quiz
•
3rd Grade
20 questions
Main Idea and Details
Quiz
•
5th Grade
20 questions
Context Clues
Quiz
•
6th Grade
Discover more resources for Mathematics
20 questions
Writing Algebraic Expressions
Quiz
•
6th Grade
20 questions
Ratios/Rates and Unit Rates
Quiz
•
6th Grade
14 questions
Volume of rectangular prisms
Quiz
•
7th Grade
20 questions
Laws of Exponents
Quiz
•
8th Grade
20 questions
Graphing Inequalities on a Number Line
Quiz
•
6th - 9th Grade
20 questions
One Step Equations
Quiz
•
6th Grade
10 questions
Solving One Step Inequalities
Quiz
•
6th Grade
15 questions
Equivalent Ratios
Quiz
•
6th Grade