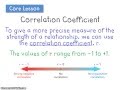
Interpreting the Correlation Coefficient
Interactive Video
•
Mathematics
•
6th - 8th Grade
•
Practice Problem
•
Medium
Standards-aligned

Sophia Harris
Used 4+ times
FREE Resource
Standards-aligned
10 questions
Show all answers
1.
MULTIPLE CHOICE QUESTION
30 sec • 1 pt
What type of correlation is represented by a line with a positive slope?
Cannot be determined
No correlation
Negative correlation
Positive correlation
Tags
CCSS.HSS.ID.B.5
2.
MULTIPLE CHOICE QUESTION
30 sec • 1 pt
Which graph typically shows the weakest correlation?
Graph with points very scattered
Graph with points slightly scattered
Graph with points closely forming a line
Graph with points forming a perfect line
Tags
CCSS.HSS.ID.B.5
3.
MULTIPLE CHOICE QUESTION
30 sec • 1 pt
What does a correlation coefficient close to 1 indicate?
No correlation
Perfect negative linear relationship
Weak correlation
Strong positive linear relationship
Tags
CCSS.HSS.ID.B.5
4.
MULTIPLE CHOICE QUESTION
30 sec • 1 pt
What does a correlation coefficient of 0.93 suggest about the data set?
Moderate positive correlation
Strong negative correlation
Strong positive correlation
No correlation
Tags
CCSS.HSS.ID.B.5
5.
MULTIPLE CHOICE QUESTION
30 sec • 1 pt
How do you access the diagnostic feature on a graphing calculator?
Press 'mode' then 'alpha'
Press 'second' then 'zero'
Press 'stat' then 'edit'
Press 'on' then 'clear'
Tags
CCSS.HSS.ID.B.6B
6.
MULTIPLE CHOICE QUESTION
30 sec • 1 pt
What is the first step in entering data into a calculator for correlation coefficient calculation?
Select 'calc' then '4: LinReg'
Turn on the diagnostic mode
Clear previous data lists
Enter values into L1 and L2
Tags
CCSS.HSS.ID.C.8
7.
MULTIPLE CHOICE QUESTION
30 sec • 1 pt
After enabling diagnostics, what additional information is displayed when calculating linear regression?
A and B coefficients only
R and R-squared values
Standard deviation
Mean and median of data sets
Access all questions and much more by creating a free account
Create resources
Host any resource
Get auto-graded reports
Continue with Google

Continue with Email
Continue with Classlink
Continue with Clever
or continue with
Microsoft
%20(1).png)
Apple
Others
Already have an account?
Popular Resources on Wayground

15 questions
Fractions on a Number Line
Quiz
•
3rd Grade
20 questions
Equivalent Fractions
Quiz
•
3rd Grade
25 questions
Multiplication Facts
Quiz
•
5th Grade
54 questions
Analyzing Line Graphs & Tables
Quiz
•
4th Grade
22 questions
fractions
Quiz
•
3rd Grade
20 questions
Main Idea and Details
Quiz
•
5th Grade
20 questions
Context Clues
Quiz
•
6th Grade
15 questions
Equivalent Fractions
Quiz
•
4th Grade
Discover more resources for Mathematics
22 questions
distributive property
Quiz
•
7th Grade
18 questions
Angle Relationships
Quiz
•
7th Grade
15 questions
Distributive Property & Review
Quiz
•
6th Grade
20 questions
Writing Algebraic Expressions
Quiz
•
6th Grade
20 questions
How Some Friendships Last — and Others Don’t Video Questions
Quiz
•
7th Grade
14 questions
finding slope from a graph
Quiz
•
8th Grade
20 questions
Ratios/Rates and Unit Rates
Quiz
•
6th Grade
18 questions
Handbook Refresher Quiz
Quiz
•
7th Grade