Exploring Box and Whisker Plots
Interactive Video
•
Mathematics
•
6th - 8th Grade
•
Practice Problem
•
Hard
+1
Standards-aligned

Aiden Montgomery
FREE Resource
Standards-aligned
Read more
10 questions
Show all answers
1.
MULTIPLE CHOICE QUESTION
30 sec • 1 pt
What does a box and whisker plot typically show?
Standard deviation and variance
Frequency of data points
Minimum, Q1, median, Q3, and maximum
Mean and mode
Tags
CCSS.6.SP.B.4
CCSS.HSS.ID.A.1
2.
MULTIPLE CHOICE QUESTION
30 sec • 1 pt
What is the median value in a box and whisker plot?
The average of all data points
The difference between Q1 and Q3
The middle value when data is ordered
The most frequently occurring number
Tags
CCSS.6.SP.B.4
CCSS.HSS.ID.A.1
3.
MULTIPLE CHOICE QUESTION
30 sec • 1 pt
How is the first quartile (Q1) calculated in a box and whisker plot?
Maximum value minus the median
Median of the top half of the data
Average of all data points
Median of the bottom half of the data excluding the median
Tags
CCSS.6.SP.B.4
CCSS.HSS.ID.A.1
4.
MULTIPLE CHOICE QUESTION
30 sec • 1 pt
How do you find Q3 in a box and whisker plot?
It's the maximum value of the data set
It's the average of all data points
It's the median of the upper half of the data
It's the median of the lower half of the data
Tags
CCSS.6.SP.B.4
CCSS.HSS.ID.A.1
5.
MULTIPLE CHOICE QUESTION
30 sec • 1 pt
What is the interquartile range in a box and whisker plot?
Q1 minus median
Median minus minimum
Maximum minus minimum
Q3 minus Q1
Tags
CCSS.6.SP.B.4
CCSS.HSS.ID.A.1
6.
MULTIPLE CHOICE QUESTION
30 sec • 1 pt
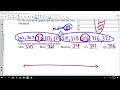
Which period had the lowest median score?
Data not sufficient to determine
Period 3
Period 2
Period 1
Tags
CCSS.HSS.ID.A.3
7.
MULTIPLE CHOICE QUESTION
30 sec • 1 pt
Which period had the highest median score?
Period 1
Period 2
Period 3
All periods had the same median score
Tags
CCSS.HSS.ID.A.3
Access all questions and much more by creating a free account
Create resources
Host any resource
Get auto-graded reports
Continue with Google

Continue with Email
Continue with Microsoft
or continue with

%20(1).png)
Apple
Others
Already have an account?
