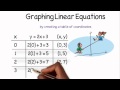
Graphing Linear Equations through Coordinate Tables
Interactive Video
•
Mathematics
•
6th - 8th Grade
•
Practice Problem
•
Hard
+2
Standards-aligned

Liam Anderson
FREE Resource
Standards-aligned
10 questions
Show all answers
1.
MULTIPLE CHOICE QUESTION
30 sec • 1 pt
What is the primary goal when graphing the equation y = 2x + 3?
To determine the slope of a quadratic curve
To plot points that form a linear pattern
To find the maximum value of y
To calculate the highest possible x value
2.
MULTIPLE CHOICE QUESTION
30 sec • 1 pt
Which x values are chosen to find corresponding y values for the equation y = 2x + 3?
0, 1, 2, 3
-1, 0, 1, 2
1, 2, 3, 4
0, 2, 4, 6
Tags
CCSS.HSF.IF.A.2
3.
MULTIPLE CHOICE QUESTION
30 sec • 1 pt
What is the y value when x = 1 in the equation y = 2x + 3?
6
5
3
4
Tags
CCSS.HSF.IF.A.2
4.
MULTIPLE CHOICE QUESTION
30 sec • 1 pt
How is the scale for the x-axis determined in the graph of y = 2x + 3?
Increment by 2
Increment by 0.5
Increment by 1
Increment by 3
5.
MULTIPLE CHOICE QUESTION
30 sec • 1 pt
What is the correct coordinate point for x = 2 in the equation y = 2x + 3?
(2, 5)
(2, 8)
(2, 6)
(2, 7)
Tags
CCSS.8.F.A.1
CCSS.HSF.IF.A.1
6.
MULTIPLE CHOICE QUESTION
30 sec • 1 pt
What method is used to show the linear pattern in the graph of y = 2x + 3?
Shading the area under the curve
Plotting additional points randomly
Drawing a circle through the points
Using a ruler to connect the dots
7.
MULTIPLE CHOICE QUESTION
30 sec • 1 pt
What does the arrow at the end of the line in the graph indicate?
The line stops at the last point
The values of x are limited
The graph is incorrect
The line extends infinitely
Tags
CCSS.HSF-IF.C.7A
Access all questions and much more by creating a free account
Create resources
Host any resource
Get auto-graded reports
Continue with Google

Continue with Email
Continue with Classlink
Continue with Clever
or continue with
Microsoft
%20(1).png)
Apple
Others
Already have an account?
Popular Resources on Wayground

7 questions
History of Valentine's Day
Interactive video
•
4th Grade
15 questions
Fractions on a Number Line
Quiz
•
3rd Grade
20 questions
Equivalent Fractions
Quiz
•
3rd Grade
25 questions
Multiplication Facts
Quiz
•
5th Grade
22 questions
fractions
Quiz
•
3rd Grade
15 questions
Valentine's Day Trivia
Quiz
•
3rd Grade
20 questions
Main Idea and Details
Quiz
•
5th Grade
20 questions
Context Clues
Quiz
•
6th Grade
Discover more resources for Mathematics
20 questions
Writing Algebraic Expressions
Quiz
•
6th Grade
20 questions
Ratios/Rates and Unit Rates
Quiz
•
6th Grade
14 questions
Volume of rectangular prisms
Quiz
•
7th Grade
20 questions
Laws of Exponents
Quiz
•
8th Grade
20 questions
Graphing Inequalities on a Number Line
Quiz
•
6th - 9th Grade
20 questions
One Step Equations
Quiz
•
6th Grade
10 questions
Solving One Step Inequalities
Quiz
•
6th Grade
15 questions
Equivalent Ratios
Quiz
•
6th Grade