
Exploring Box-and-Whisker Plots

Interactive Video
•
Mathematics
•
9th - 12th Grade
•
Hard
Standards-aligned

Sophia Harris
FREE Resource
Standards-aligned
Read more
10 questions
Show all answers
1.
MULTIPLE CHOICE QUESTION
30 sec • 1 pt
What percentage of data does each quarter in a box plot represent?
25%
100%
50%
75%
Tags
CCSS.6.SP.B.4
CCSS.HSS.ID.A.1
2.
MULTIPLE CHOICE QUESTION
30 sec • 1 pt
What is located at the ends of the whiskers in a box plot?
Mean and Median
Median and Mode
Minimum and Maximum
First and Third Quartiles
Tags
CCSS.6.SP.B.4
CCSS.HSS.ID.A.1
3.
MULTIPLE CHOICE QUESTION
30 sec • 1 pt
Which value is represented by the line in the middle of the box in a box plot?
Median
Mode
Range
Mean
Tags
CCSS.6.SP.B.4
CCSS.HSS.ID.A.1
4.
MULTIPLE CHOICE QUESTION
30 sec • 1 pt
How is the lower quartile (Q1) determined in a box plot?
Maximum value
Median of the lower half
Average of all data
Median of the upper half
Tags
CCSS.6.SP.B.4
CCSS.HSS.ID.A.1
5.
MULTIPLE CHOICE QUESTION
30 sec • 1 pt
What is the correct sequence to arrange data for a box plot?
Grouped by value
From smallest to largest
Randomly
From largest to smallest
Tags
CCSS.6.SP.B.4
CCSS.HSS.ID.A.1
6.
MULTIPLE CHOICE QUESTION
30 sec • 1 pt
What does the median of the upper half of the data represent in a box plot?
Lower Quartile
Upper Quartile
Minimum
Median
Tags
CCSS.6.SP.B.4
CCSS.HSS.ID.A.1
7.
MULTIPLE CHOICE QUESTION
30 sec • 1 pt
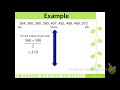
In the provided example, what is the median value?
459
572
407
370
Tags
CCSS.6.SP.B.5C
Create a free account and access millions of resources
Similar Resources on Wayground
2 questions
GCSE Secondary Maths Age 13-17 - Probability & Statistics: Box Plot - Explained

Interactive video
•
10th - 12th Grade
10 questions
Understanding Box Plots and Salary Comparisons

Interactive video
•
9th - 12th Grade
6 questions
GCSE Secondary Maths Age 13-17 - Probability & Statistics: Comparing data - Explained

Interactive video
•
10th - 12th Grade
4 questions
GCSE Secondary Maths Age 13-17 - Probability & Statistics: Box Plot - Explained

Interactive video
•
10th - 12th Grade
9 questions
Understanding Box Plots and Summary Statistics

Interactive video
•
9th - 10th Grade
6 questions
Choosing the Best Representation: Dot Plots, Histograms, and Box Plots

Interactive video
•
9th - 10th Grade
11 questions
Statistical Measures in Real Estate

Interactive video
•
9th - 12th Grade
6 questions
Learn how to create a box and whisker plot for a set of data

Interactive video
•
11th Grade - University
Popular Resources on Wayground
10 questions
Lab Safety Procedures and Guidelines

Interactive video
•
6th - 10th Grade
10 questions
Nouns, nouns, nouns

Quiz
•
3rd Grade
10 questions
9/11 Experience and Reflections

Interactive video
•
10th - 12th Grade
25 questions
Multiplication Facts

Quiz
•
5th Grade
11 questions
All about me

Quiz
•
Professional Development
22 questions
Adding Integers

Quiz
•
6th Grade
15 questions
Subtracting Integers

Quiz
•
7th Grade
9 questions
Tips & Tricks

Lesson
•
6th - 8th Grade
Discover more resources for Mathematics
12 questions
Graphing Inequalities on a Number Line

Quiz
•
9th Grade
15 questions
Two Step Equations

Quiz
•
9th Grade
16 questions
Segment Addition Postulate

Quiz
•
10th Grade
12 questions
Absolute Value Equations

Quiz
•
9th Grade
20 questions
Parallel Lines and Transversals Independent Practice

Quiz
•
10th Grade
15 questions
Combine Like Terms and Distributive Property

Quiz
•
8th - 9th Grade
16 questions
Parallel Lines cut by a Transversal

Quiz
•
10th Grade
20 questions
Solving Multi-Step Equations

Quiz
•
10th Grade