Exploring Bar Graphs and Data Interpretation
Interactive Video
•
Mathematics
•
1st - 5th Grade
•
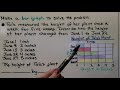
Practice Problem
•
Hard
+7
Standards-aligned

Amelia Wright
FREE Resource
Standards-aligned
Read more
10 questions
Show all answers
1.
MULTIPLE CHOICE QUESTION
30 sec • 1 pt
What does a bar graph help us compare?
Different colors
Shapes
Numerical values on a scale
Text labels
Tags
CCSS.2.MD.D.10
2.
MULTIPLE CHOICE QUESTION
30 sec • 1 pt
What does an increase in a bar graph indicate?
Decreased values
Stable values
Increased values
No change
Tags
CCSS.3.MD.B.3
3.
MULTIPLE CHOICE QUESTION
30 sec • 1 pt
How did the number of books Dave read change from May to August?
Data not available
Increased
No change
Decreased
4.
MULTIPLE CHOICE QUESTION
30 sec • 1 pt
What trend is observed in the number of lawns Bob mowed from September to November?
Fluctuated
Increased
Decreased
Remained constant
Tags
CCSS.6.SP.B.5C
CCSS.HSS.ID.A.3
5.
MULTIPLE CHOICE QUESTION
30 sec • 1 pt
What does a decrease in a bar graph typically signify?
Increased activity
Reduced quantities
Data error
Stable conditions
Tags
CCSS.3.MD.B.3
6.
MULTIPLE CHOICE QUESTION
30 sec • 1 pt
How many ribbons are less than five inches long according to the line plot?
Seven
Four
Five
Six
Tags
CCSS.2.MD.D.9
CCSS.3.MD.B.4
7.
MULTIPLE CHOICE QUESTION
30 sec • 1 pt
What is the purpose of a line plot in data analysis?
To show data increase
To compare different months
To count specific data points
To color code data
Tags
CCSS.6.SP.B.4
CCSS.HSS.ID.A.1
Access all questions and much more by creating a free account
Create resources
Host any resource
Get auto-graded reports
Continue with Google

Continue with Email
Continue with Microsoft
or continue with

%20(1).png)
Apple
Others
Already have an account?
