Exploring Data Tables and Graphs
Interactive Video
•
Mathematics
•
1st - 5th Grade
•
Practice Problem
•
Medium
+1
Standards-aligned

Olivia Brooks
Used 14+ times
FREE Resource
Standards-aligned
10 questions
Show all answers
1.
MULTIPLE CHOICE QUESTION
30 sec • 1 pt
What is the starting value of the green graph mentioned in the tutorial?
79,000
82
880,000
0
Tags
CCSS.HSF-IF.C.7E
2.
MULTIPLE CHOICE QUESTION
30 sec • 1 pt
What should every data table include according to the tutorial?
Multiple colors
A detailed description
A complex formula
A title
3.
MULTIPLE CHOICE QUESTION
30 sec • 1 pt
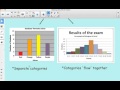
Which type of graph is used for separate categories?
Histogram
Bar graph
Pie chart
Line graph
4.
MULTIPLE CHOICE QUESTION
30 sec • 1 pt
What is a common mistake when creating graphs as mentioned in the tutorial?
Using too many colors
Confusing bar graphs with histograms
Labeling the axes incorrectly
All of the above
Tags
CCSS.6.SP.B.4
CCSS.HSS.ID.A.1
5.
MULTIPLE CHOICE QUESTION
30 sec • 1 pt
What is the main difference between a bar graph and a histogram?
Bar graphs show trends over time
Histograms have non-touching bars
Bar graphs have separate, non-touching categories
Histograms use only horizontal bars
Tags
CCSS.6.SP.B.4
CCSS.HSS.ID.A.1
6.
MULTIPLE CHOICE QUESTION
30 sec • 1 pt
How can predictions be made using a line graph?
By extending the last line segment
By averaging all data points
By using a pie chart
By guessing the next value
7.
MULTIPLE CHOICE QUESTION
30 sec • 1 pt
What trend analysis method involves connecting the first and last points?
Long-term trend analysis
Short-term trend analysis
Mid-term trend analysis
None of the above
Access all questions and much more by creating a free account
Create resources
Host any resource
Get auto-graded reports
Continue with Google

Continue with Email
Continue with Microsoft
or continue with

%20(1).png)
Apple
Others
Already have an account?
