Exploring Stem and Leaf Plots
Interactive Video
•
Mathematics
•
1st - 5th Grade
•
Practice Problem
•
Medium

Mia Campbell
Used 1+ times
FREE Resource
Read more
10 questions
Show all answers
1.
MULTIPLE CHOICE QUESTION
30 sec • 1 pt
What is the primary purpose of a stem-and-leaf plot?
To measure data accuracy
To calculate the average of data
To organize and display data
To predict future trends
2.
MULTIPLE CHOICE QUESTION
30 sec • 1 pt
In a stem-and-leaf plot, what does the 'leaf' typically represent?
The highest value in the data
The lowest value in the data
The rightmost digit of the number
The total count of data points
3.
MULTIPLE CHOICE QUESTION
30 sec • 1 pt
What does the stem in a stem-and-leaf plot represent?
The leftmost digit(s) of the number
The decimal part of the number
The percentage of data points
The frequency of the highest value
4.
MULTIPLE CHOICE QUESTION
30 sec • 1 pt
What is the first step in creating a stem-and-leaf plot?
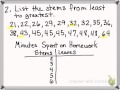
List the data from least to greatest
Organize the leaves alphabetically
List the stems in descending order
Draw the plot on graph paper
5.
MULTIPLE CHOICE QUESTION
30 sec • 1 pt
How are leaves arranged in a stem-and-leaf plot?
Alphabetically
In descending order
Randomly
In ascending order
6.
MULTIPLE CHOICE QUESTION
30 sec • 1 pt
Which value represents the maximum time spent on homework according to the stem-and-leaf plot?
21 minutes
64 minutes
40 minutes
50 minutes
7.
MULTIPLE CHOICE QUESTION
30 sec • 1 pt
What does a key in a stem-and-leaf plot indicate?
The average value of the data
The total number of data points
How to read the values
The range of data
Access all questions and much more by creating a free account
Create resources
Host any resource
Get auto-graded reports
Continue with Google

Continue with Email
Continue with Classlink
Continue with Clever
or continue with
Microsoft
%20(1).png)
Apple
Others
Already have an account?
Similar Resources on Wayground
Popular Resources on Wayground

15 questions
Fractions on a Number Line
Quiz
•
3rd Grade
20 questions
Equivalent Fractions
Quiz
•
3rd Grade
25 questions
Multiplication Facts
Quiz
•
5th Grade
54 questions
Analyzing Line Graphs & Tables
Quiz
•
4th Grade
22 questions
fractions
Quiz
•
3rd Grade
20 questions
Main Idea and Details
Quiz
•
5th Grade
20 questions
Context Clues
Quiz
•
6th Grade
15 questions
Equivalent Fractions
Quiz
•
4th Grade
Discover more resources for Mathematics
15 questions
Fractions on a Number Line
Quiz
•
3rd Grade
20 questions
Equivalent Fractions
Quiz
•
3rd Grade
25 questions
Multiplication Facts
Quiz
•
5th Grade
54 questions
Analyzing Line Graphs & Tables
Quiz
•
4th Grade
22 questions
fractions
Quiz
•
3rd Grade
15 questions
Equivalent Fractions
Quiz
•
4th Grade
18 questions
Comparing Fractions with same numerator or denominator
Quiz
•
3rd Grade
16 questions
Interpreting Line Graphs & Double Tables
Quiz
•
4th Grade