Interpreting Double Bar Graphs
Interactive Video
•
Mathematics
•
1st - 5th Grade
•
Practice Problem
•
Medium
+2
Standards-aligned

Mia Campbell
Used 8+ times
FREE Resource
Standards-aligned
10 questions
Show all answers
1.
MULTIPLE CHOICE QUESTION
30 sec • 1 pt
What does a pink bar typically represent in the discussed double bar graph?
Likes
Dislikes
No opinion
Not specified
Tags
CCSS.2.MD.D.10
2.
MULTIPLE CHOICE QUESTION
30 sec • 1 pt
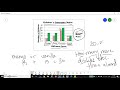
What does the green bar typically indicate in the children's ice cream preference graph?
Likes
Dislikes
No data
Indifferent
Tags
CCSS.2.MD.D.10
3.
MULTIPLE CHOICE QUESTION
30 sec • 1 pt
How should you interpret a striped bar in a black and white double bar graph?
No opinion
Likes
Dislikes
Data missing
Tags
CCSS.2.MD.D.10
4.
MULTIPLE CHOICE QUESTION
30 sec • 1 pt
How many children liked mango ice cream according to the graph?
30
5
20
15
Tags
CCSS.2.MD.D.10
5.
MULTIPLE CHOICE QUESTION
30 sec • 1 pt
What is the combined number of children who liked mango and vanilla ice cream?
25
45
30
15
Tags
CCSS.8.SP.A.4
6.
MULTIPLE CHOICE QUESTION
30 sec • 1 pt
What is the total number of children who disliked almond ice cream?
5
20
10
15
Tags
CCSS.1.MD.C.4
7.
MULTIPLE CHOICE QUESTION
30 sec • 1 pt
How many more children disliked chocolate than almond?
15
5
10
20
Tags
CCSS.3.MD.B.3
Access all questions and much more by creating a free account
Create resources
Host any resource
Get auto-graded reports
Continue with Google

Continue with Email
Continue with Microsoft
or continue with

%20(1).png)
Apple
Others
Already have an account?
