Interpreting Circle Graphs Effectively
Interactive Video
•
Mathematics
•
1st - 5th Grade
•
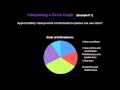
Practice Problem
•
Medium
+2
Standards-aligned

Ethan Morris
Used 8+ times
FREE Resource
Standards-aligned
10 questions
Show all answers
1.
MULTIPLE CHOICE QUESTION
30 sec • 1 pt
What is another name for a circle graph?
Bar chart
Line graph
Pie chart
Histogram
2.
MULTIPLE CHOICE QUESTION
30 sec • 1 pt
What is the primary purpose of using a circle graph?
To display data parts as a whole
To predict future trends
To compare quantities
To show changes over time
3.
MULTIPLE CHOICE QUESTION
30 sec • 1 pt
Which sector represents the largest number of species in the echinoderms graph?
Sea cucumbers
Brittle stars and basket stars
Sea stars
Sea urchins and sand dollars
Tags
CCSS.5.G.A.2
4.
MULTIPLE CHOICE QUESTION
30 sec • 1 pt
Approximately what percentage of the echinoderms are sea stars?
75%
50%
10%
25%
5.
MULTIPLE CHOICE QUESTION
30 sec • 1 pt
Which group has fewer species, sea cucumbers or sea urchins and sand dollars?
Data not available
Both have the same
Sea urchins and sand dollars
Sea cucumbers
6.
MULTIPLE CHOICE QUESTION
30 sec • 1 pt
What is the total number of degrees in a circle used in the calculations?
100 degrees
90 degrees
180 degrees
360 degrees
Tags
CCSS.4.MD.C.5B
CCSS.HSG.CO.A.1
7.
MULTIPLE CHOICE QUESTION
30 sec • 1 pt
How many people surveyed said they do not own any pets?
15 people
10 people
20 people
25 people
Tags
CCSS.1.MD.C.4
Access all questions and much more by creating a free account
Create resources
Host any resource
Get auto-graded reports
Continue with Google

Continue with Email
Continue with Microsoft
or continue with

%20(1).png)
Apple
Others
Already have an account?
