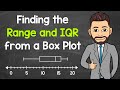
Finding Range and IQR from Box Plots
Interactive Video
•
English
•
1st - 5th Grade
•
Practice Problem
•
Medium
Standards-aligned

Ethan Morris
Used 45+ times
FREE Resource
Standards-aligned
Read more
10 questions
Show all answers
1.
MULTIPLE CHOICE QUESTION
30 sec • 1 pt
What does the range in a dataset represent?
The middle 50% of the data
The sum of all data points
The average value of the dataset
The difference between the highest and lowest values
Tags
CCSS.6.SP.B.4
CCSS.HSS.ID.A.1
2.
MULTIPLE CHOICE QUESTION
30 sec • 1 pt
How is the range calculated from a box plot?
Subtracting the third quartile from the first quartile
Adding the maximum and minimum values
Subtracting the minimum value from the maximum value
Finding the average of all data points
Tags
CCSS.6.SP.B.4
CCSS.HSS.ID.A.1
3.
MULTIPLE CHOICE QUESTION
30 sec • 1 pt
Which value represents the maximum in the provided dataset?
18 hours
9 hours
4 hours
16 hours
Tags
CCSS.6.SP.B.4
CCSS.HSS.ID.A.1
4.
MULTIPLE CHOICE QUESTION
30 sec • 1 pt
What is the minimum value in the dataset as shown in the box plot?
4 hours
9 hours
14 hours
18 hours
Tags
CCSS.6.SP.B.4
CCSS.HSS.ID.A.1
5.
MULTIPLE CHOICE QUESTION
30 sec • 1 pt
What is the calculated range of the dataset?
10 hours
14 hours
7 hours
12 hours
Tags
CCSS.6.SP.B.4
CCSS.HSS.ID.A.1
6.
MULTIPLE CHOICE QUESTION
30 sec • 1 pt
What is the interquartile range (IQR) in a dataset?
The difference between the mean and median
The range of the entire dataset
The sum of the first and third quartiles
The range of the middle 50% of the data
Tags
CCSS.6.SP.B.5C
7.
MULTIPLE CHOICE QUESTION
30 sec • 1 pt
How do you find the interquartile range using a box plot?
Adding the first and third quartiles
Multiplying the first quartile by the third quartile
Subtracting the minimum from the maximum
Subtracting the first quartile from the third quartile
Tags
CCSS.6.SP.B.4
CCSS.HSS.ID.A.1
Access all questions and much more by creating a free account
Create resources
Host any resource
Get auto-graded reports
Continue with Google

Continue with Email
Continue with Classlink
Continue with Clever
or continue with
Microsoft
%20(1).png)
Apple
Others
Already have an account?
