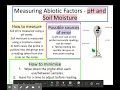
Sampling Techniques and Environmental Indicators
Interactive Video
•
Biology, Science
•
7th - 10th Grade
•
Practice Problem
•
Hard

Amelia Wright
FREE Resource
Read more
10 questions
Show all answers
1.
MULTIPLE CHOICE QUESTION
30 sec • 1 pt
Which of the following is NOT a learning objective mentioned in the introduction?
Explain the process of photosynthesis
Describe abiotic and biotic factors
Explain what an indicator species is
Use and construct paired statement keys
2.
MULTIPLE CHOICE QUESTION
30 sec • 1 pt
Which of the following is an example of an abiotic factor?
Predation
Competition for resources
Disease
Light intensity
3.
MULTIPLE CHOICE QUESTION
30 sec • 1 pt
What is the correct definition of biotic factors?
Physical factors that affect organisms
Non-living factors that affect organisms
Living factors that affect organisms
Chemical factors that affect organisms
4.
MULTIPLE CHOICE QUESTION
30 sec • 1 pt
Which instrument is used to measure light intensity?
pH meter
Thermometer
Moisture meter
Light meter
5.
MULTIPLE CHOICE QUESTION
30 sec • 1 pt
What is a possible source of error when using a light meter?
Standing in the path of the light
Not calibrating the meter
Measuring at night
Using the wrong type of meter
6.
MULTIPLE CHOICE QUESTION
30 sec • 1 pt
Which sampling technique is used for estimating the abundance of plants or slow-moving animals?
Transect line
Pitfall trap
Sweep net
Quadrat
7.
MULTIPLE CHOICE QUESTION
30 sec • 1 pt
How can the source of error due to non-random sampling in quadrats be minimized?
By counting only the largest plants
By using more quadrats
By placing the quadrats randomly
By using a larger quadrat
Access all questions and much more by creating a free account
Create resources
Host any resource
Get auto-graded reports
Continue with Google

Continue with Email
Continue with Classlink
Continue with Clever
or continue with
Microsoft
%20(1).png)
Apple
Others
Already have an account?
Similar Resources on Wayground
Popular Resources on Wayground

15 questions
Fractions on a Number Line
Quiz
•
3rd Grade
20 questions
Equivalent Fractions
Quiz
•
3rd Grade
25 questions
Multiplication Facts
Quiz
•
5th Grade
54 questions
Analyzing Line Graphs & Tables
Quiz
•
4th Grade
22 questions
fractions
Quiz
•
3rd Grade
20 questions
Main Idea and Details
Quiz
•
5th Grade
20 questions
Context Clues
Quiz
•
6th Grade
15 questions
Equivalent Fractions
Quiz
•
4th Grade
Discover more resources for Biology
20 questions
Cell Organelles
Quiz
•
9th Grade
14 questions
Ecological Succession: Primary and Secondary
Quiz
•
9th Grade
22 questions
Human Body Systems Overview
Quiz
•
9th Grade
25 questions
photosynthesis and cellular respiration
Quiz
•
9th Grade
21 questions
Meiosis Vs Mitosis
Quiz
•
10th Grade
20 questions
Adaptations and Natural Selection
Quiz
•
7th Grade
10 questions
Comparing Mitosis and Meiosis: Key Differences and Stages
Interactive video
•
6th - 10th Grade
13 questions
Amoeba Sisters Viruses Video quiz
Interactive video
•
9th Grade