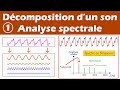
Understanding Sound Decomposition and Frequency Spectra
Interactive Video
•
Mathematics, Physics, Science
•
9th - 12th Grade
•
Practice Problem
•
Hard

Emma Peterson
FREE Resource
Read more
10 questions
Show all answers
1.
MULTIPLE CHOICE QUESTION
30 sec • 1 pt
What is the main focus of the video?
The physics of light
The decomposition of sound and frequency spectra
The history of sound
The creation of musical instruments
2.
MULTIPLE CHOICE QUESTION
30 sec • 1 pt
Which mathematician's principles are used to decompose complex sounds?
Albert Einstein
Isaac Newton
Joseph Fourier
Galileo Galilei
3.
MULTIPLE CHOICE QUESTION
30 sec • 1 pt
What type of signal is associated with a pure sound?
A non-periodic signal
A random signal
A periodic signal
A sinusoidal signal
4.
MULTIPLE CHOICE QUESTION
30 sec • 1 pt
What is the fundamental frequency also known as?
The harmonic frequency
The base frequency
The primary frequency
The fundamental frequency
5.
MULTIPLE CHOICE QUESTION
30 sec • 1 pt
How are harmonics related to the fundamental frequency?
They are equal to the fundamental frequency
They are multiples of the fundamental frequency
They are half of the fundamental frequency
They are unrelated to the fundamental frequency
6.
MULTIPLE CHOICE QUESTION
30 sec • 1 pt
What does spectral analysis of a signal involve?
Identifying the frequencies and amplitudes of sinusoidal components
Calculating the weight of the signal
Determining the color of the signal
Measuring the speed of the signal
7.
MULTIPLE CHOICE QUESTION
30 sec • 1 pt
What does a frequency spectrum graphically represent?
The speed of sound
The frequencies and their respective amplitudes
The color of sound
The weight of sound
Access all questions and much more by creating a free account
Create resources
Host any resource
Get auto-graded reports
Continue with Google

Continue with Email
Continue with Microsoft
or continue with

%20(1).png)
Apple
Others
Already have an account?
