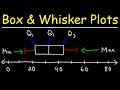
Creating Box and Whisker Plots
Interactive Video
•
Mathematics
•
6th - 10th Grade
•
Practice Problem
•
Medium
Standards-aligned

Lucas Foster
Used 80+ times
FREE Resource
Standards-aligned
Read more
10 questions
Show all answers
1.
MULTIPLE CHOICE QUESTION
30 sec • 1 pt
What are the five key data points needed for a box and whisker plot?
Minimum, Maximum, Median, Mode, Mean
Minimum, Maximum, Mean, Standard Deviation, Variance
Minimum, Maximum, First Quartile, Second Quartile, Third Quartile
First Quartile, Second Quartile, Third Quartile, Interquartile Range, Outliers
Tags
CCSS.6.SP.B.4
CCSS.HSS.ID.A.1
2.
MULTIPLE CHOICE QUESTION
30 sec • 1 pt
How is the second quartile (Q2) also known?
Mode
Mean
Range
Median
Tags
CCSS.6.SP.B.5C
3.
MULTIPLE CHOICE QUESTION
30 sec • 1 pt
How is the first quartile (Q1) determined in a dataset?
By finding the median of the lower half of the dataset
By finding the mean of the dataset
By subtracting the median from the maximum value
By adding the minimum and maximum values and dividing by two
Tags
CCSS.6.SP.B.5C
4.
MULTIPLE CHOICE QUESTION
30 sec • 1 pt
What is the Interquartile Range (IQR) calculated as?
Q3 - Q1
Q3 + Q1
Maximum - Minimum
Q2 - Q1
Tags
CCSS.6.SP.B.5C
5.
MULTIPLE CHOICE QUESTION
30 sec • 1 pt
Which value is considered an outlier if it falls outside the range of Q1 - 1.5*IQR and Q3 + 1.5*IQR?
Any data point
Mean
Median
Mode
6.
MULTIPLE CHOICE QUESTION
30 sec • 1 pt
What does the box in a box and whisker plot represent?
Range of the dataset
Mean and mode of the dataset
Interquartile range of the dataset
Total dataset including outliers
Tags
CCSS.6.SP.B.4
CCSS.HSS.ID.A.1
7.
MULTIPLE CHOICE QUESTION
30 sec • 1 pt
How do you determine if a data point is an outlier in a dataset?
If it's not within Q1 and Q3
If it's outside the range of Q1 - 1.5*IQR to Q3 + 1.5*IQR
If it's the maximum or minimum
If it's more than the mean
Access all questions and much more by creating a free account
Create resources
Host any resource
Get auto-graded reports
Continue with Google

Continue with Email
Continue with Microsoft
or continue with

%20(1).png)
Apple
Others
Already have an account?
