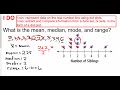
Calculating Mean, Median, Mode, and Range from Dot Plots
Interactive Video
•
Mathematics
•
6th - 10th Grade
•
Practice Problem
•
Hard
+3
Standards-aligned

Sophia Harris
FREE Resource
Standards-aligned
Read more
10 questions
Show all answers
1.
MULTIPLE CHOICE QUESTION
30 sec • 1 pt
What is the first step to prepare your calculator for data analysis?
Update the calculator's software
Turn it off and on again
Clear and reset the calculator
Change the batteries
2.
MULTIPLE CHOICE QUESTION
30 sec • 1 pt
Which of the following is a correct way to reset a calculator as mentioned in the video?
Pressing 'AC' button
Selecting second, zero, then seven, one, two
Holding the power button for 5 seconds
Removing and reinserting the batteries
3.
MULTIPLE CHOICE QUESTION
30 sec • 1 pt
How many ones are present in the initial dataset discussed?
Two
Three
Five
Four
Tags
CCSS.6.SP.B.5A
4.
MULTIPLE CHOICE QUESTION
30 sec • 1 pt
What is the mode of the initial dataset discussed in the video?
4
3
2
1
Tags
CCSS.6.SP.B.5C
5.
MULTIPLE CHOICE QUESTION
30 sec • 1 pt
How many twos are in the dataset used for the calculator demonstration?
Two
Three
Four
Five
Tags
CCSS.6.SP.B.5A
6.
MULTIPLE CHOICE QUESTION
30 sec • 1 pt
What statistical measure is represented by 'x-bar' in calculator statistics?
Mean
Range
Mode
Median
Tags
CCSS.6.SP.B.5C
7.
MULTIPLE CHOICE QUESTION
30 sec • 1 pt
What does the range represent in a dataset?
The average of all the numbers
The difference between the highest and lowest values
The most frequently occurring number
The middle value of the dataset
Tags
CCSS.6.SP.B.4
CCSS.HSS.ID.A.1
Access all questions and much more by creating a free account
Create resources
Host any resource
Get auto-graded reports
Continue with Google

Continue with Email
Continue with Classlink
Continue with Clever
or continue with
Microsoft
%20(1).png)
Apple
Others
Already have an account?
