Exploring Dot Plots in Data Representation
Interactive Video
•
Mathematics
•
6th - 10th Grade
•
Practice Problem
•
Hard
Standards-aligned

Emma Peterson
FREE Resource
Standards-aligned
10 questions
Show all answers
1.
MULTIPLE CHOICE QUESTION
30 sec • 1 pt
What is the purpose of a dot plot?
To organize data in a neat and clear manner
To calculate the average of data
To create a complex representation of data
To represent data in a textual format
Tags
CCSS.6.SP.B.4
CCSS.HSS.ID.A.1
2.
MULTIPLE CHOICE QUESTION
30 sec • 1 pt
How many students sent 12 text messages?
1
2
3
4
Tags
CCSS.6.SP.B.4
CCSS.HSS.ID.A.1
3.
MULTIPLE CHOICE QUESTION
30 sec • 1 pt
How many students sent more than 13 text messages?
0
2
3
4
Tags
CCSS.6.SP.B.4
CCSS.HSS.ID.A.1
4.
MULTIPLE CHOICE QUESTION
30 sec • 1 pt
What characteristic of dot plots allows for quick data analysis?
Color coding
Numerical order
Textual annotations
Graphical representation
Tags
CCSS.6.SP.B.5A
5.
MULTIPLE CHOICE QUESTION
30 sec • 1 pt
What does it mean if a dot plot is symmetrical?
Data is skewed to the left
All data points are the same
Data is evenly distributed around the middle
Data is skewed to the right
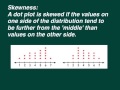
6.
MULTIPLE CHOICE QUESTION
30 sec • 1 pt
What indicates a dot plot is skewed to the left?
Even distribution of data points
More data points on the right side of the middle
Data points are all at the center
More data points on the left side of the middle
7.
MULTIPLE CHOICE QUESTION
30 sec • 1 pt
What indicates a dot plot is skewed to the right?
More data points on the right side of the middle
Even distribution of data points
Data points are all at the center
More data points on the left side of the middle
Access all questions and much more by creating a free account
Create resources
Host any resource
Get auto-graded reports
Continue with Google

Continue with Email
Continue with Microsoft
or continue with

%20(1).png)
Apple
Others
Already have an account?
