- Resource Library
- Math
- Data And Graphing
- Histogram Interpretation
- Analyzing Histograms And Frequency Tables
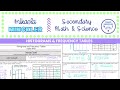
Analyzing Histograms and Frequency Tables
Interactive Video
•
Mathematics
•
6th - 10th Grade
•
Practice Problem
•
Hard
+5
Standards-aligned

Amelia Wright
FREE Resource
Standards-aligned
Read more
10 questions
Show all answers
1.
MULTIPLE CHOICE QUESTION
30 sec • 1 pt
What does 'frequency' in a histogram represent?
The width of each bar
How often a data point occurs
The range of data values
The height of each bar
Tags
CCSS.6.SP.B.4
CCSS.HSS.ID.A.1
2.
MULTIPLE CHOICE QUESTION
30 sec • 1 pt
What is the mode in a set of data?
The least occurring value
The most frequently occurring value
The middle value
The average value
Tags
CCSS.6.SP.B.5C
3.
MULTIPLE CHOICE QUESTION
30 sec • 1 pt
How is a histogram different from a bar graph?
Histograms can only show numerical data
Bar graphs do not show frequencies
Histograms use lines instead of bars
Bar graphs categorize data in non-sequential order
Tags
CCSS.6.SP.B.4
CCSS.HSS.ID.A.1
4.
MULTIPLE CHOICE QUESTION
30 sec • 1 pt
How do you find the percentage of a category in a frequency table?
Subtract the category's frequency from the total frequencies
Multiply the category's frequency by 100
Divide the category's frequency by the total frequencies
Add all frequencies and divide by the number of categories
Tags
CCSS.8.SP.A.4
5.
MULTIPLE CHOICE QUESTION
30 sec • 1 pt
What age range had the highest frequency in the student histogram?
5 to 6 years
7 to 8 years
9 to 10 years
11 to 12 years
Tags
CCSS.5.G.A.2
6.
MULTIPLE CHOICE QUESTION
30 sec • 1 pt
How many students were younger than 9 years old?
20 students
35 students
45 students
60 students
Tags
CCSS.2.MD.D.9
7.
MULTIPLE CHOICE QUESTION
30 sec • 1 pt
What fraction of students are aged 7 to 8 years?
1/4
1/3
3/12
15/60
Tags
CCSS.3.NF.A.1
CCSS.3.NF.A.2B
Access all questions and much more by creating a free account
Create resources
Host any resource
Get auto-graded reports
Continue with Google

Continue with Email
Continue with Microsoft
or continue with

%20(1).png)
Apple
Others
Already have an account?
