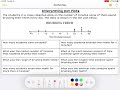
Interpreting Dot Plots Effectively
Interactive Video
•
Mathematics
•
6th - 10th Grade
•
Practice Problem
•
Hard
+4
Standards-aligned

Lucas Foster
FREE Resource
Standards-aligned
Read more
10 questions
Show all answers
1.
MULTIPLE CHOICE QUESTION
30 sec • 1 pt
How many students participated in the survey?
7 students
9 students
8 students
10 students
Tags
CCSS.6.SP.B.5A
2.
MULTIPLE CHOICE QUESTION
30 sec • 1 pt
What is the median brushing time among the students?
3 minutes
3.5 minutes
3.75 minutes
4 minutes
Tags
CCSS.6.SP.B.5C
3.
MULTIPLE CHOICE QUESTION
30 sec • 1 pt
What is the median value when two middle values are present?
The lower value
Sum of the two values
The higher value
Average of the two values
Tags
CCSS.6.SP.B.5C
4.
MULTIPLE CHOICE QUESTION
30 sec • 1 pt
How is the range of brushing times calculated?
Sum of all times
Average of all times
Maximum time plus minimum time
Maximum time minus minimum time
Tags
CCSS.6.SP.B.4
CCSS.HSS.ID.A.1
5.
MULTIPLE CHOICE QUESTION
30 sec • 1 pt
What is the range of brushing times?
2.5 minutes
4 minutes
3 minutes
3.5 minutes
Tags
CCSS.2.MD.B.5
6.
MULTIPLE CHOICE QUESTION
30 sec • 1 pt
How many students brushed their teeth for more than three minutes?
6 students
5 students
7 students
4 students
Tags
CCSS.2.MD.D.9
CCSS.3.MD.B.4
7.
MULTIPLE CHOICE QUESTION
30 sec • 1 pt
How many students brushed their teeth exactly for four minutes?
3 students
5 students
2 students
4 students
Tags
CCSS.2.MD.D.9
CCSS.3.MD.B.4
Access all questions and much more by creating a free account
Create resources
Host any resource
Get auto-graded reports
Continue with Google

Continue with Email
Continue with Microsoft
or continue with

%20(1).png)
Apple
Others
Already have an account?
